I’m a market history guy, and this is quite a good story to tell. If you can recall back into 2013, you’ll remember $AAPL trading in a similar range YTD. It was a $400 stock, but the price range, under performance, and sentiment were all the same.
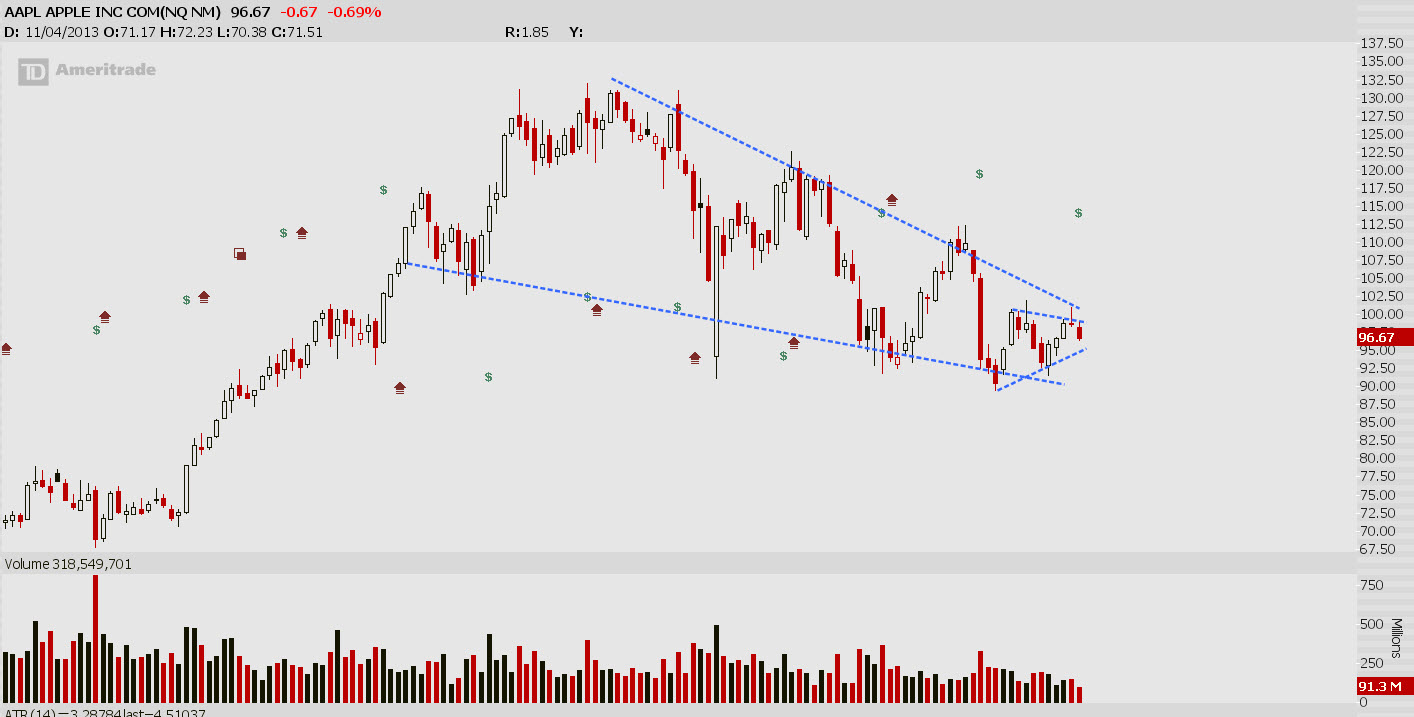
Here’s a look at the two charts:
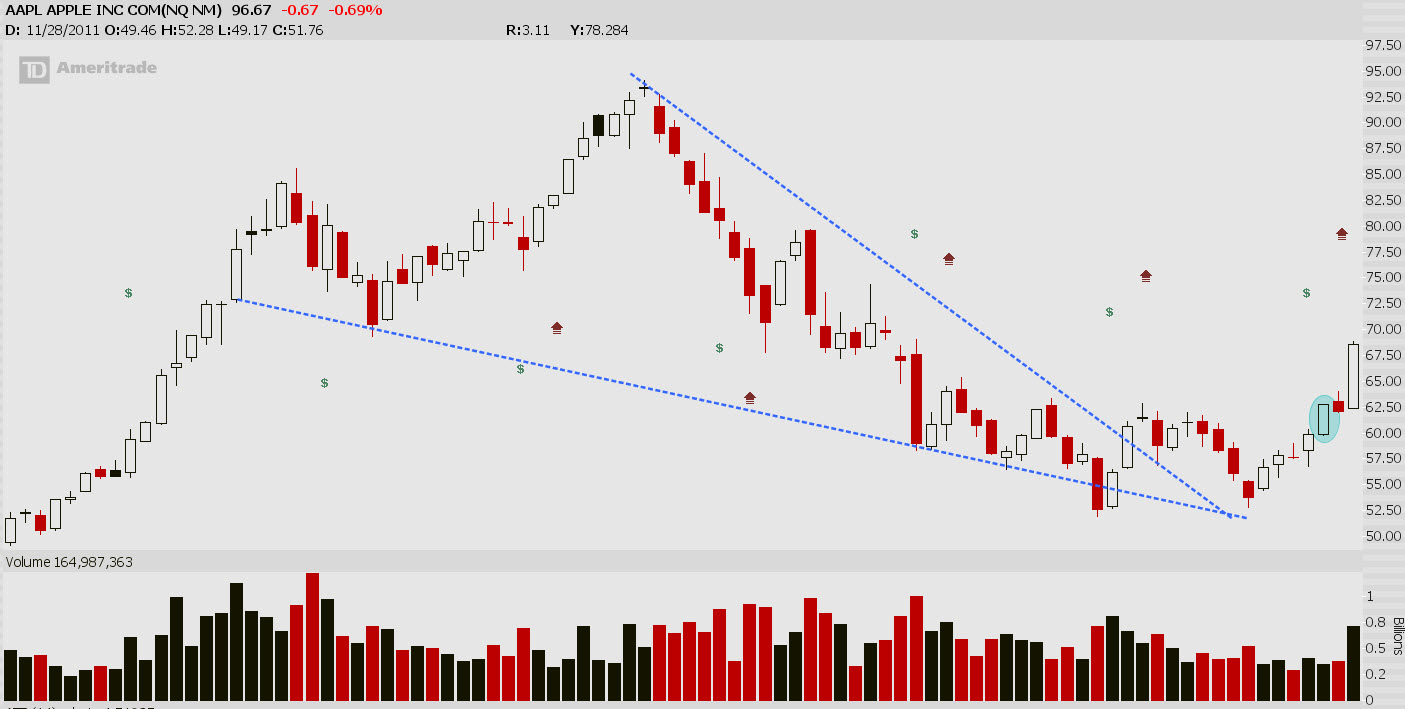
I spent a lot of time covering the sentiment in $AAPL. There was a great dialogue about it back then, as well as an earnings trade that quarter when the stock broke out and never looked back.
I highlighted the weekly bar above in the 2013 chart, which serves as a good analog to current price action.
Here’s a weekly chart of $AAPL in its current set-up.
The best tell from all this was the options. In both scenarios, this was the cheapest the options have been heading into earnings. Implied volatility hasn’t been this low for $AAPL since that 2013 earnings release.
To recall how bad sentiment was, it was a hot topic here at iBC. It was hated on the same way it has been now. Bearish opinions outweighed at least 5:1.
Should be a runner at the open when people realize they don’t own enough. I loaded up with some calls yesterday a few hours after the downgrade.
OA
If you enjoy the content at iBankCoin, please follow us on Twitter


Awesome detailed post! Any charts in the steel sector getting you giddy? I’m looking into $TMST shares for a trade that could go bonkers? Thoughts? Thanks!
$X at $6 was a generational buy. I still own $AKS but that $TMST has a great profile.
Thanks OA! I just scanned $KOL top holdings for coking plays…..wtf?
I’ve got to agree with you from earlier today OA, about not giving a fuck about what the market does. Driving home from work and CBS radio dude is like “the DOW was down 19.” Doesn’t even get close to describing what’s happening under the surface here right now.
AAPL is -30% off it’s highs even after this rip. I’m not excited.
You laying off the googl?
Any concern about the rising dollar and its effect on crude?
Dollar is a short here.
Why do you think it’s a short?
Same reason oil is a long. Don’t see a similarity? Inverse correlation?
Lol of course I do just curious what you see on the chart
Did a post on oil this morning. If you look at the chart I posted while standing on your head, you’ll see the dollar.
Do you have any advice for re balancing when you’re shit is at the top of it’s range?
?
Like for example I’m holding RPD and not sure if I should expect that it comes back in towards balance? I haven’t sold shit since BREXIT really, mostly stocks you’ve discussed. I guess earnings will help free up some cash
I don’t play for the range, I play for breakouts.
I held ATHM through 12 percent decline and that fucker is almost back to where I bought it – play for the breakout?
Why else do you play it?
You do have bowling balls homie. Thanks!
Interesting chart re: fund manager cash on sidelines
http://361capital.com/wp-content/uploads/2016/07/25/ml.png
Yeah, I’ve been beating this same drum. Lowest exposure to equities as well.
Craziest thing about the Cash stat is it has actually increased since February of this year which was the lowest in a decade or so.
Have some August 105 calls; thinking about letting it run.
FCX doing work today.