I’m going to start with a longer term monthly chart of the Nasdaq. In terms of where the market is in trouble, I am using the following levels to work off of.
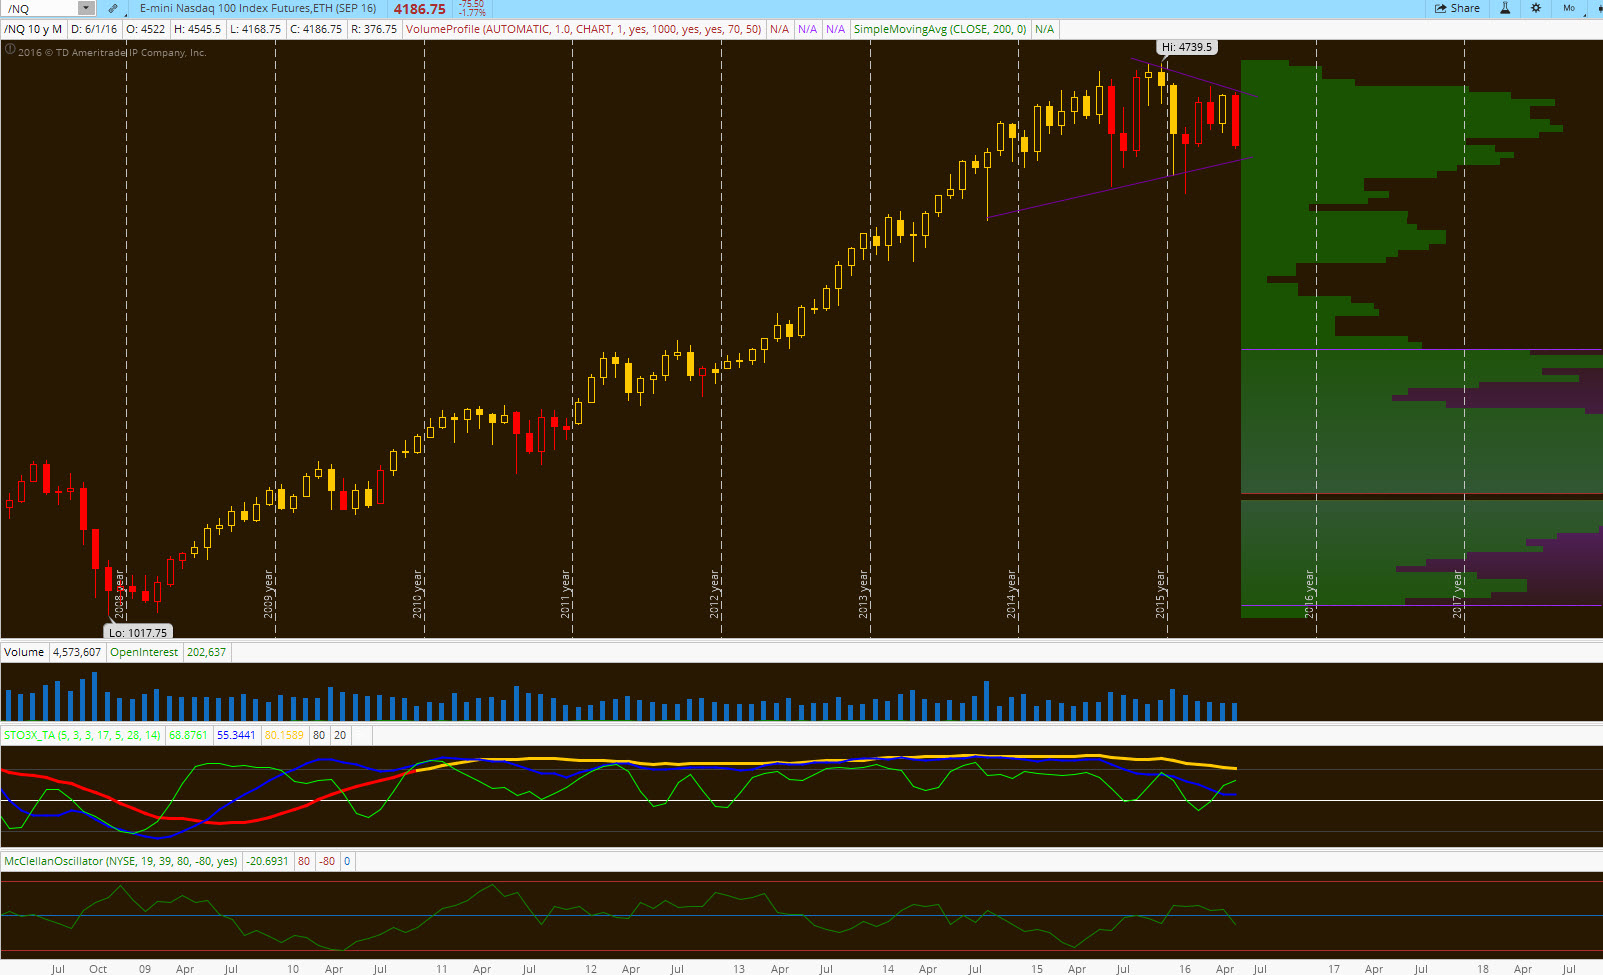
Using the NQ, which has been the index I’ve been using, I could see us grind down another 100 points from here. At that point, you may get an oversold McClellan to work with.
Now that prices have come back to the lower end of this range, I think it pushes back the timing of when we could break away from this by a few months. In other words, the daily chart was getting pretty compressed, but this move to the lower end keeps the monthly range contracting. That monthly range says we could still be here, at these prices in 2-3 months.
That’s the most depressing part about all this, in my opinion. More time must pass.
OA
If you enjoy the content at iBankCoin, please follow us on Twitter


Wow that Is probably the most depressing post I’ve read on here
Depressing? Why?
well, for those that bought this 1000 pt dip, have to wait it sounds like.
I bought a tiny amount on friday and much more today. but maybe i’m too early.
OA.. what is the McClellan now?
-55
wow. that’s it after a 1000 drop?? that’s nuts. -80 is oversold right?
You never disappoint.
a little light heartedness in the midst of chaos
things I’ve noticed today:
Good: (1) $VIX -8% with indices down 2%. (2) $TSLA up today- that doesn’t make sense if the world were coming to an end. Their founder just inked an ego-stoking, nepostism-fueled insider deal which was among the worst in history (I’m told).
Bad: financials.
May try a weekly long in an index into the close, but not looking to be a hero.
TSN, HRL, CALM and other food products companies are up last two days.
people will load up on SPAM should armageddon occur
IBB better find support at 240 right here, right now, or this shits gonna get real in a heartbeat
after 240 comes 200ish
yup agreed. looks ugly beneath.
Closed out my long IBB position from yesterday for a nice profit. It will probably hit $250, but I’m still fundamentally bearish on the market even if my positions are neutral
smart move. rally starting to fade already
OA – I have seen you use the logarithmic scale on prophet charts at times and some times not. When toggling that on and off it can have a dramatic difference in the chart setup from one stock to the next. Any guidance on when you use it and when you don’t?… which one do you use most often? I can’t be on for the AHWOA live today so will catch the recording if chose to talk about it there. Thanks!
I change to fit.
Bought MS, GPS and MGM. These stocks refuse to go down more.
Inverted H&S for IWM
Anyone following the $VIX? It is experiencing a nice surge after hours.
Yup. S&P futures down about 10 already. Bear market
I don’t think I can tolerate you for another move lower. You might wake up to banishment this time around.
there it is. Bottom.
it was down 10 pts shortly after close. what’s the big deal about that. was just answering a question. Not like i’m enjoying this down move.
Nothing you post here is worth the effort to read. Try and work on posting something worthwhile rather than the constant emotional outbursts of total bullshit.
i don’t agree, but sorry you think that. Anyways, let’s make some money tomorrow.
+1000
Vol spike in TSLA at 11:55. Interesting.
So obviously Monday’s volume is smaller than Friday’s. I think the rest of this week’s volume vs market direction will be a bigger tell than most weeks on where the market is headed, that and whether the week ends up or down, particularly for the Nasdaq. At least this week should make positioning for the rest of the year a (relatively) easy exercise.
long NQ 4186
The bullish case has the market retracing the Brexit decline like, TOMORROW, with a robust jump this week back into resistance and the upper zone of the trading range. Unfortunately, markdowns tend to be a continuation of a huge volume Brexit-like day that we saw Friday, which actually could have been the completion of a major distributive top. There are three scenarios that support the bearish case. First scenario, we have a weak low volume low quality rally back to the midpoint of the distribution range. It could take a few weeks, then another leg down. Second, price trades sideways 1-2 weeks then continues down. Or third, weakness continues all this week signifying we are in a markdown phase. Whether we are in a bear market still remains to be seen. My current allocation is 27% SPY, 36% TLT, 9% DBC, 9% GLD and 19% cash. No individual stocks anymore, especially with earnings season coming up.
Sold GBP last night for nominal gain, should have held.
Sold my small ES @2011
Trimmed TWTR July calls only 5 contracts left
Bought AAL weekly 25.5’s right here
Won’t attempt to fade this unless we get to 203 on the SPY
Looks like a tiny bit more downside in $PACB and it will find November support. I’ve got my eye on it for LT. Toying with a couple of other ideas as well. Insane bounce in $EVEP.
OA, how do you see the week playing out? A couple day rally would be nice. Thanks
The first rally always fails. You have to buy that weakness because everyone gets bearish.
Looking forward to buying the next dip. Missed LABU at 22 and hoping she gets there again.
OA, I thought that the NDX would close/test the Fri/Mon gap on the first rally day (so far, it hasn’t, but there’s still time, of course). If it doesn’t then that’s a bearish sign and I think we make a short-term lower low before the next rally starts.
If it doesn’t close the gap today, do you think yesterday’s low will hold this week?