I just had this chart pass by me, and I think it is worth a strong glance over.
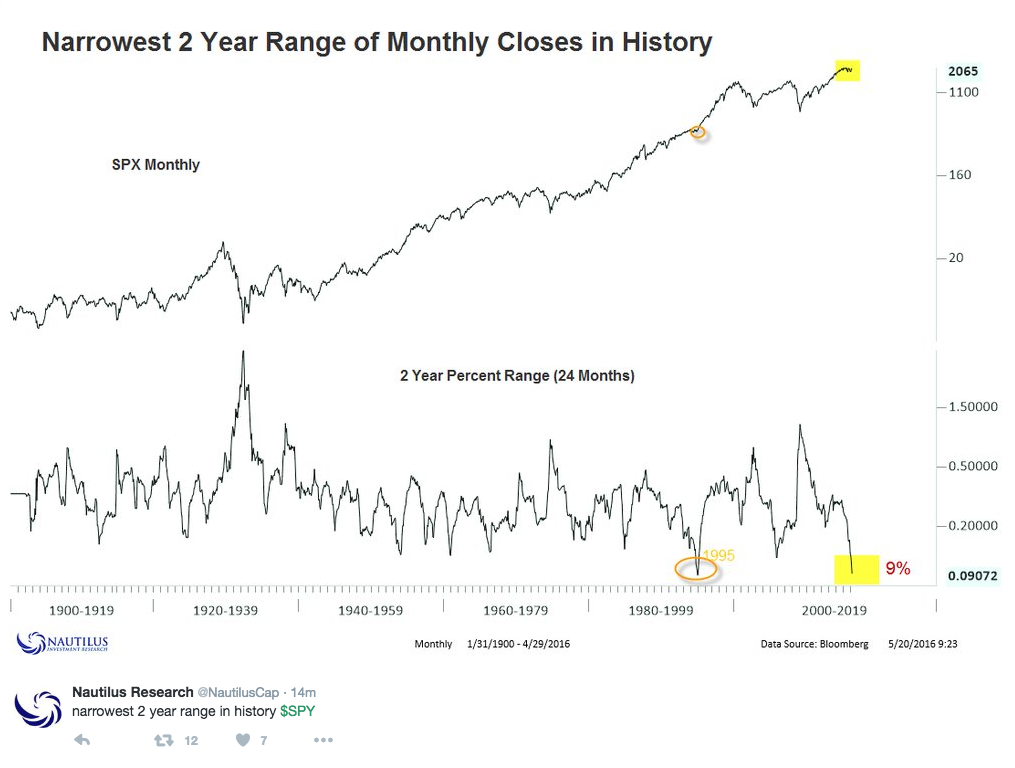 The last time the market was this compressed was in 94-95. Right at the time the Fed went on hits rate hike binge, rattling the bond market and opening the flood gates for money to come back into equities.
End of 2015 I wrote the following about the market coming into the year:
Around this time of year, I’ll usually highlight a chart that is one we’ll reference many times in the coming year. A chart that will define the year, basically. Last year it was $FDN, and how that would be the chart that “defined 2015.” This was simply because its largest weightings were FANGS (Facebook, Amazon, Netflix, Google, Salesforce.com). Cap weighted growth was my favorite theme for 2015, and this ETF covered all of them. Pretty good theme for the year, no?
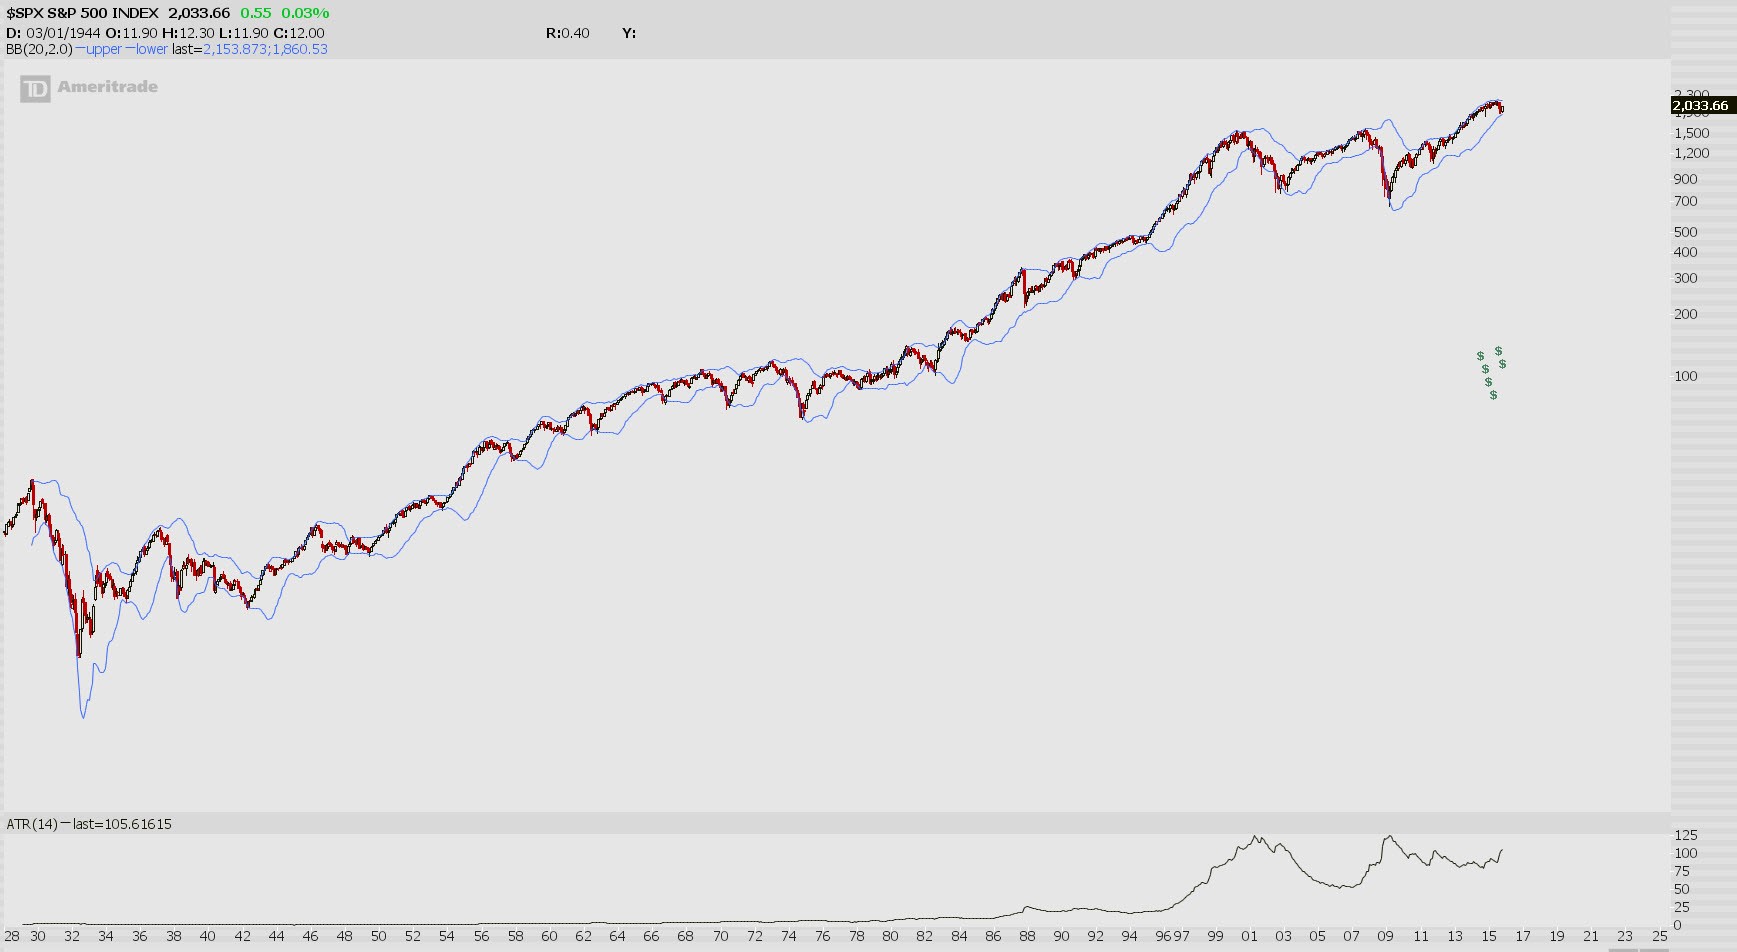
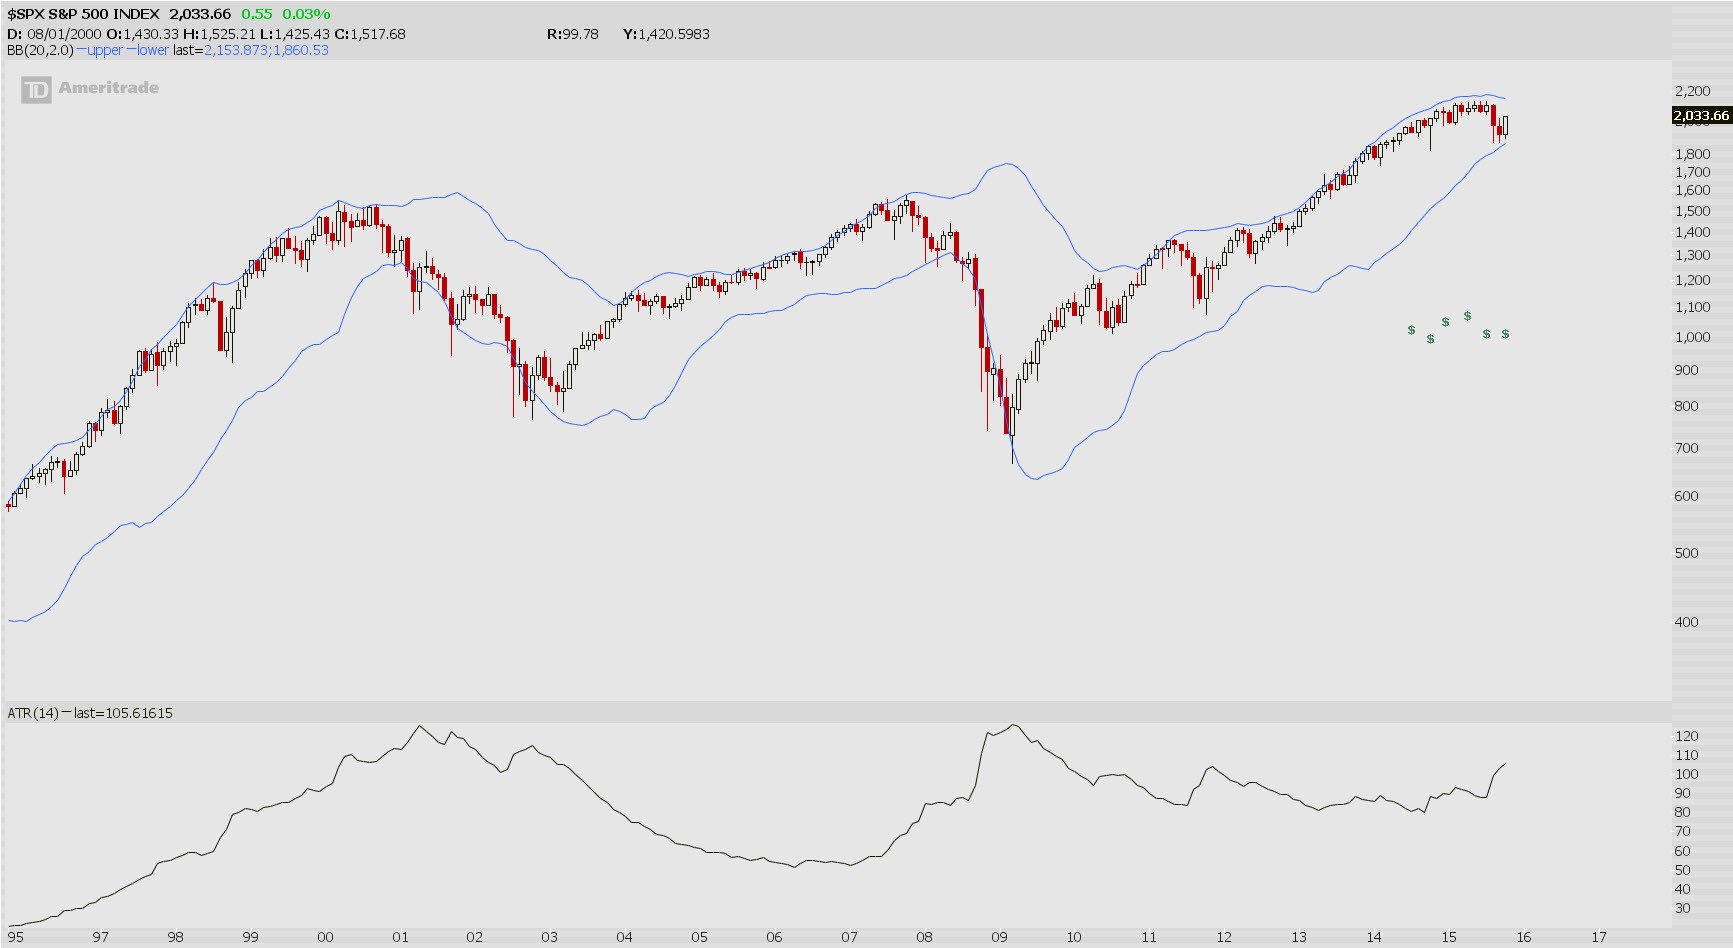
For 2016, there’s a significant amount of compression built up. Here’s a look at the monthly chart I used for the NYC presentation, and another chart that zooms in, and also adds a Bollinger Width indicator, to show you just how narrow this range really is.
Here’s that chart again:
Contracting volatility on any time frame is an important element of my analysis, and this is why I’ve been so steadfast on where the market is headed from here. This is the type of signal that forecasts the fastest market moves…and all things considered, in my opinion, is heading much higher.
This is the best time of the year to learn a little bit about stock picking. As a reminder, the Boot Camp starts on Monday. I’m super excited about this, as I think the timing of it all couldn’t be scripted better. If you have any questions about this, let me know, otherwise CLICK HERE to sign up.
OA
If you enjoy the content at iBankCoin, please follow us on Twitter


IMAX has my eye hear, for a pop to 37.5. May pick up a couple June 35s, reasonable r/r.
*here, sigh. Hate when I do that!
One thing is for sure we are getting very close to a resolution.
Haven’t we been saying that for months
Uhh, no. Market has been trending just fine for months.
BB width will prolly just keep getting tighter until the next Fed statement
Super pumped for this round of boot camp. You’re right about the good timing. I need to sharpen my stock picking skills if we’re about to have a run like that.
Okay I’m attending the camp
S&P PE ratio was around 15 in ’95, today it is around 23, which is historically still high. Will that matter? There are others such as Armstrong who think that similarly, the liquidity exiting the bond market will flood equities once interest rates start rising.
How are you accounting for GAAP vs non-GAAP reporting standards in the PE ratios?
It’s not an AAPLs to AAPLs comparison w/o an adjustment.
Give recession a chance
Did they have an ultra-easy Fed and QE inspired global risk-asset bubble back in the 1990’s….
Funny how at the end of the day, that’s always the last words thrown from that camp. Like an “all else fails” comment.
I’d tumblr that one for sure.
Without much effort or insight, this is sorta what I’m talking about…
http://www.businessinsider.com/sp-500-gaap-versus-non-gaap-pe-ratios-2015-6
This market is different than 08-09, the bank leverage is night and day. Look at your favorite QQQ stocks, commodities, energy, and tell me that we are in the same market as then. Even with the gov’t pushing liquidity, we are not awash in crappy loans like then. We can debate what will happen a couple years out, but right now there is no direct comparison.
We have to slay this recency bias towards the pain we felt in the last decade, because this is not the same situation. This is an after-effect of then, different, not the same.
“we are not awash in crappy loans like then” ……you arent looking hard enough. Looking at the same loan types at the heart of ’08-’09 as your indicator will prove to be a mistake. There are plenty of crappy loans, they just aren’t subprime RMBS this time.
Saw something similar http://www.seeitmarket.com/sp-500-bollinger-bands-squeeze-massive-move-brewing-stocks-15482/
Encouraging but wish the sample size wasn’t so dominated by 1994-95
I guess a question I have if the move is going to be huge then theoretically there would be a lot of meat left even post breakout. If so when to the time to jump on the wagon? And what would be the qualitative clues?
One note on that table: it pretty much represents 3 periods: Jun’94 – Mar ’95, Aug-Sep ’77, and present day. So two known results and one TBD results don’t add up to much data.
As stated below, the mid-90s bull market didn’t start until the FED started lowering rates again.
Sorry, I guess we saw the same thing on the chart (94-95…).
Anyway, I guess the time to jump on baord is when the FED lowers again!
Look at the chart I posted…84-85, 78-79…easy to see where the market had been compressed before a trend started.
I do agree with your statement, “This is the type of signal that forecasts the fastest market moves,” but combined with other data (including forecasted FED rate hikes), I think the move is down.
Ummm, things didn’t happen as you are implying: FED *lowering* led to the rising markets in the ’90s, not FED rate hikes. I’m actually a bit surprised that no one has double checked you on this yet, but I guess the rest of the bears hang out with the Fly.
Zoom in on the 90s (5-yr or shorter timescale) and it’s plain as day:
Jan ’90 – Sep ’92: FED drops repeatedly (7.5% – > 2.75%), market drops at first (bank crisis) then rises and finishes up 15%-20%
Oct ’92 – Jan ’94: FED basically holds rates, market up 10%
*** Feb ’94 – Feb ’95: FED “rate hike binge” (3% – 5.75%), market basically holds position (slightly down) ***
*** Mar 95 – Dec 95′: FED lowers rates slightly (5.75% -> 5%), market rises > 20% ***
Jan 96′ – Jul 98′: Rates constant, market almost double
Aug 98: markets fal 20% -> FED plunges rates (5 -> 3.5%)
Sep 98 – Oct 99: FED slowly raise rates to pre-Aug 98, market rises
Nov 99 – Dec 00: FED raises rates (too late), market overheats and crashes
Also, narrowing Bollinger Bands (by mathematical definition) don’t indicate reduced volatility, they just tell you the market is going sideways (ex: a market that goes up exactly 2% every month has 0% volatility but wide bands; a market that goes up 5%, then down 5% alterantely has narrow BBs but high volatility).
Speaking of month2month volatility, (using a period of 12 months), it was sitting pretty low but is now rising: bottomed in Jan 2015 @7.8% and is now @14.5%. Last time it went from below 10% to above 14%: June 2008. Of course, the time before that was May 1997. Given the last two crashes, I doubt we go the irrational exuberance route this time and I think the party ends sooner.
rapidly (already higher than
So annoying.
Of course I know the trend of rates, but this post is on 94-95, no? Maybe bond market ‘volatility’ is a more suitable description for you?
And you’re absolutely wrong about bands. No need to even argue that.
One thing at a time, to avoid misunderstanding.
The big thing statement I had issues with was “Fed went on its rate hike binge…opening the flood gates for money to come back into equities” implying that the historical charts you showed implied a bullish bounce in stocks once the FED starts raising rates. Isn’t that what you meant?
OA: “Of course I know the trend of rates, but this post is on 94-95, no?”
Ok, so I added irrelevant facts initially, here is a more succinct rebuttal
1) FED rates flat in 93 (heading into ’94), and started increasing in Feb 1994.
2) FED rates doubled from Feb 1994 – Feb 1995
FED rates: https://research.stlouisfed.org/fred2/series/DFEDTAR
3) The S&P 500 was flat (actually fell slightly) during Feb 1994 – Feb 1995
Data shows that the FED raised rates for a 1-year period, and stocks did not rise during that 1 year period. They started falling at the *end of the 1 year period*, but I don’t think you are trying to convince your readers that the charts you showed means that the market will be flat for a year, then rise after that.
*should be
“They started rising at…”
I said “The last time the market was this compressed was in 94-95. Right at the time the Fed went on hits rate hike binge, rattling the bond market and opening the flood gates for money to come back into equities.”
http://www.businessinsider.com/1994-federal-reserve-tightening-story-2013-1
To set the record straight, I never questioned the intuitive assumption that the FED raising rates would rattle the bond markets.
It’s the implied ***stock market effect*** that I question:
if the “flood” of money went into equities, why was the market flat for a year?
http://www.bis.org/publ/work32.pdf
This breaks it down pretty well.
Volatility can mean different things.
If a stock rises *exactly* 5% each month, do you consider that volatile? I don’t because it isn’t swinging up and down: you know the market is going up.
Strictly speaking, stock volatility refers to the variabilty in the *rate* of return, so the volatility is defined as 0 (ie, change in price = 5 ±0%). However, the bolinger bands will still be quite wide, because the closing prices will differ significantly during the period in question (price = x ± 50% over 21 periods).
On the other hand, if a stock went up 5% one period, then down 5% the next period, then up 5%, then down 5%, etc., then the volatility would be high (returns would be 0% ±5%), but the Bollinger Bands would be very fairly narrow (especially compared to the previous examle), becuase closing price would fall in a narrower range. (price = x ±2.6%).
So which do you consider more volatile?
Another way to look at it: bollinger bands may show “volatility” decreasing during 2015 up to the present, but historical, calculated volatility (variability in month to month returns) has been rising since early 2015.
Think about it: with the Aug 2015 and Jan/Feb market plunges, then you know intuitively volatility was rising, not falling, since July 2015
Alternately, download the m2m closings and calculate the historical volatility on a spreadsheet, and you’ll see it.
Historic debt will put a lid on any upside move going forward……..This debt is Global and it is real.
Negative was sooo last week…if OAs rotational thesis proves correct, the continued outflow out of equities (15 weeks) will prove to be another classic example of retail investors and weak institutional hands selling to the big boys at a major inflection point.
Nobody could have predicted last week’s surprises out of AAPL / AMAT / WMT which should negate any bearish thesis. WMT and AMAT beat by a mile and their reports signal all is well with the consumer and mark a possible renaissance in semiconductor capex. These reports trump any earnings misses (rear view mirror look) from retailers, energy cos, and the like.
Lots of technical hurdles to overcome and not all stocks will move at the same time so there will be a lot of cross currents to confuse both camps. Take a longer term perspective when looking at charts (ie Weekly / Monthly vs. 15 minutes) and look for situations where bulls are assuming control from the bears (ie. FIT, NFLX, TSLA, Biotech).
Winning stocks could run for weeks (and more likely months) at a time so consider a longer holding period as opposed to the stick n move mindset that has permeated our markets for the last few years. Nothing more regretful than selling a 20% winner that proceeds to triple from your original entry point.
“Negative was sooo last week” That’s for sure: http://ibankcoin.com/option_addict/2016/05/17/oa-buy-shak-2/#comment-84085
While prudent bears (call me Smoky) should heed the warnings, the fact that this week’s surprises wer so unpredictable should give any bull pause before declaring the start of a weeks long run-up. It’s a little early for champagne.
My opinions (understandign your trading/charting experience is much greater)
FIT actually doesn’t look too bad at these levels.,
NFLX went up on 15M in volume Friday, but down on 20M volume the previous Thursday. It has upward momentum and can probably get under $95, but still expect it to close the gap it just left.
TSLA won’t get past $220 (my short calls are at $240), as investors are still optimistically ignoring the negative Op-Ex cashflow (more important than the negative earnings numbers). I will double-down on this regardless of any chart readings, just roll to later months.
IBB doesn’t look that bad from a risk/reward ratio, but it’s presently at an obvious horizontal resistance level near 265. It wouldn’t surprise me if it tests $270 as well, but I’ve got no feel beyond that (up or down).
http://fat-pitch.blogspot.com/2016/05/weekly-market-summary.html?spref=tw
That’s a nice blog that I haven’t seen before. They have several informative post. Thanks.
Wow. Good stuff going on here. Natgas is about to go bonkers.
My turnaround stock of the year, CF is now free to turn around as they wisely cancelled their inversion deal.
Arb traders will be covering their shorts. Now it can trade off AG /NG prices.
I have been staring down a bunch of ag names for way too long without getting in. $MOS / $AVD / $TNH / $CF / $POT. Looks like it’s too late for a couple, will have to jump on the next dip for the balance.
94.5 was/is a key level for NFLX – I got some 96 calls near the open
I saw the same line – however, I added to my short position (long put spread) on the basis that it would be resistance and only the analyst upgrade got it to that point.
I’ll reduce my position at any point below 92.7 (taking some profits) or a close above 96.5 (my theory was wrong).
X looks like it wants to break out of its downturn.
looks like the news on AAPL caught a few people offsides – I will admit that I did not think it would rally above 95 and had a few puts on last week that didn’t go so well
I apparently am the only one posting? All while working – helps when you are doing open source research on the Internet….
Someone mentioned transports shaping up late last week. Looking at June 18 TRN calls today.
OA, IYT or XTN, which do you recommend? Still like the transports for a couple months out? Thanks.
I like IYT