I cleaned up the charts and added labels to help illustrate the concept.
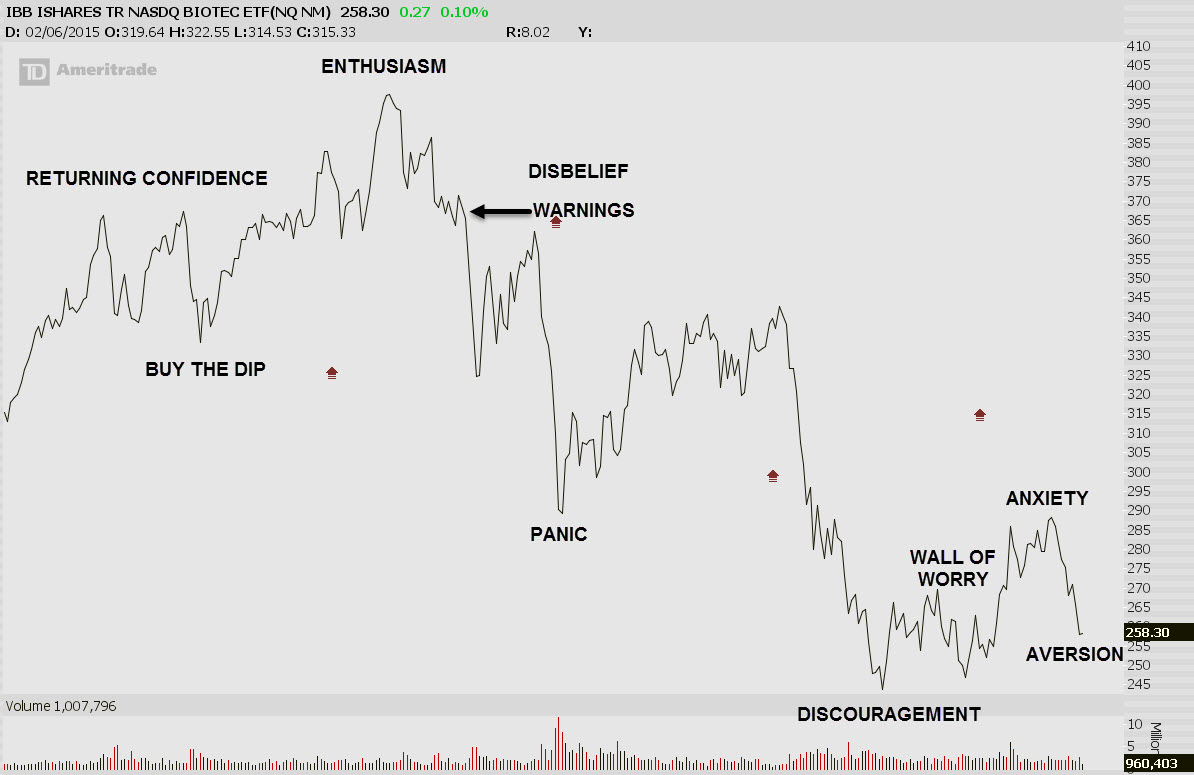
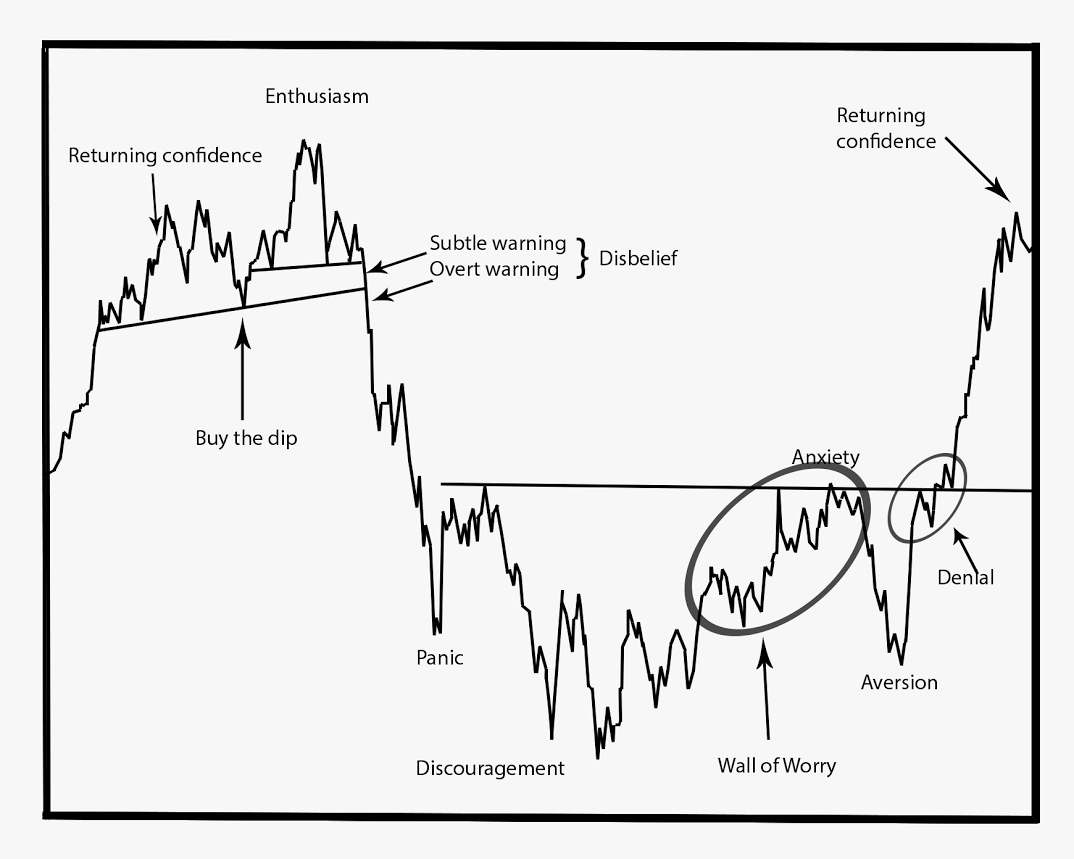
Pretty similar, no?
Let me know where you think the holes are in this analysis. As for today, $IBB having a hard time moving away from POC at $258 today and not following the market lower.
If you enjoy the content at iBankCoin, please follow us on Twitter


Any thoughts on the dollar move lower being a false breakdown? Seems pretty strong past few sessions…
Go back to my profile I posted and look at the significance of today’s high. It hasn’t been able to move beyond this yet.
I think djmarkus is talking about a higher timeframe. So far on a weekly/daily chart the false breakdown is currently so. (which is not to say that it couldn’t turn out to be a failed false breakdown later on)
My profile I posted was a 10 yr chart. I believe we’re talking the same language.
20yr. My bad.
http://ibankcoin.com/option_addict/files/2016/04/2016-04-27_10-38-59.jpg
Gotcha — thanks.
the bulls need to get going here. The longer we hang around these levels the greater the chance for a rug pull.
Really uncanny setup. Even the little blips in price match the other chart.
I picked up small batch of deep ITM IBB calls today. Enough divergence to drive this to 270-275 but I’m sure you are thinking a lot higher.
That said, if the equity indexes didn’t look like they were stabilizing though I wouldn’t have taken this setup.
Almost a perfect duplicate to the Mamis sentiment chart. The last two dips look a bit like a double bottom also. We bounce here. Took the $ONVO and may go $LABU for a trade or take the $IBB or $XBI calls.
This chart works philosophically, but it also would seem to indicate that the stock/index never actually goes lower…at some point the comparisons fail and the chart has a total meltdown, which one could argue there is a very strong setup for this sector right now.
That also raises the question of whether this entire move is a smaller move in the context of a broader move lower…or perhaps bio can stabilize and/or make a small move higher while the rest of the market has a bigger breakdown.
If you believe the market as a whole is about to make a move higher, this comparison makes sense.
Last bear market in 2008 followed this pretty closely.
2011 was an exact replica.
If the longer term trend is in tact, which it is, the analysis on the daily works for these periods of turbulence.
My problem is that we aren’t in an overall bear market, we are irrationally near all-time highs. The long-term trend is in tact…until it isn’t.
This is certainly a very good spot to take a shot – if the lows hold you are OK, if they are violated you know you’re wrong.
Because I am leaning bearish, I’m using it the opposite way – I exited my BIS trade earlier in the week (also lightened up on UVXY and others relating to broader market, FWIW) and am watching to see if the pattern holds true, or if it breaks down.
From a macro perspective, I’m trying to think about how the market interprets Trump v. Hillary and possible implications – Longer term, I can’t imagine biotech comes out of that clean either way.
We’re talking $IBB, right? $IBB is not in a bear market? How on earth do you define a bear market?
You don’t need to interpret anything here. It’s being interpreted for you.
Odds of GOOGL breaking through this mini ceiling here, OA? I’m about as decisive as a nerd during rush week here…
I like this thinking! I’d want to see a higher low established first before I would consider the aversion thesis. A strong close today above yesterday’s high would confirm it for me—a sign that the institutions are about to squeeze the shorts. It’s definitely worth watching. Or, one might anticipate that happening, and establish a small position by using…options!
This is a higher low. This cuts right into the middle of discouragement, as discussed yesterday.
How can it be a higher low on IBB? Am I looking at the same chart? To me the low isn’t established until we see a swing reversal to the upside. I don’t see what you’re seeing.
Yeah, we definitely see different things I suppose.
every mini rally sold off. been saying the same things all week, yet the next day even lower.
bchu bottom here maybe!!
No, we’re not lower. NQ still at Friday’s lows. $IBB still holding $258. Get your facts together dude.
i said in a prior post, bio looks to be bottoming. i meant lower on the 3 major indices every day based off closing. red every day this week means lower everyday to me. Slow death for option players which i bet most of your guys are. praying for a 1 day pop to get to breakeven most likely.
Looks right to me. But just wish the the weekly14,3,3 stochastic was on the bottom looking up.
Those things take a year to turn. Worst indicators ever.
I stopped using stochastic years ago…never proved to be reliable…
On that time frame it looks very similar. On a longer timeframe it looks like a massive head and shoulders. How many people use this sentiment chart?
Just the smart ones.
Looks like a falling wedge. Bullish, IMO.
http://ibankcoin.com/option_addict/files/2016/05/2016-05-05_13-20-48.jpg
Looks like the C wave of an A-B-C hasn’t completed yet if I’m reading the waves correctly. C looks vulnerable to 210.
Not to belabor this but…the establishment of a low is confirmed by the swing reversal to the upside with at least one or two closes above the high of the low bar. In the case of IBB, I don’t see that…yet. However, it also depends on the time frame we’re looking at.
My chart clearly illustrates this low here being higher than the last swing lows.
My guts tell me to trust you OA !!
I’m just blogging what I am doing here…has nothing to do with trust. You gotta make your own decisions.
What do you think about sentiment data like this, OA?
http://charts.stocktwits.com/production/original_54167245.?1462381050
I think HF positioning is always a fade. Most of those guys have less experience at this than you do.
OA,
any concern about the $RUT diverging there at the end of the day?
They all finished at lows for the day.