Earlier in the year, we talked about the nature of how quiet the year was. This was, of course, in early August. It was the quietest market range at that point, YTD, on record. Here’s the stat we ran back then:

If you zoom out a bit, the market has gone nowhere in the last two years. That’s not necessarily a positive or negative stat…it all depends on several factors. Most of which I will highlight in an upcoming boot camp.
In terms of compression, in the NYC presentation we discussed how speed plays a role in marking an environment, and in a possible topping process. I presented a few charts I want to display again, going into the 2016. Around this time of year, I’ll usually highlight a chart that is one we’ll reference many times in the coming year. A chart that will define the year, basically. Last year it was $FDN, and how that would be the chart that “defined 2015.” This was simply because its largest weightings were FANGS (Facebook, Amazon, Netflix, Google, Salesforce.com). Cap weighted growth was my favorite theme for 2015, and this ETF covered all of them. Pretty good theme for the year, no?
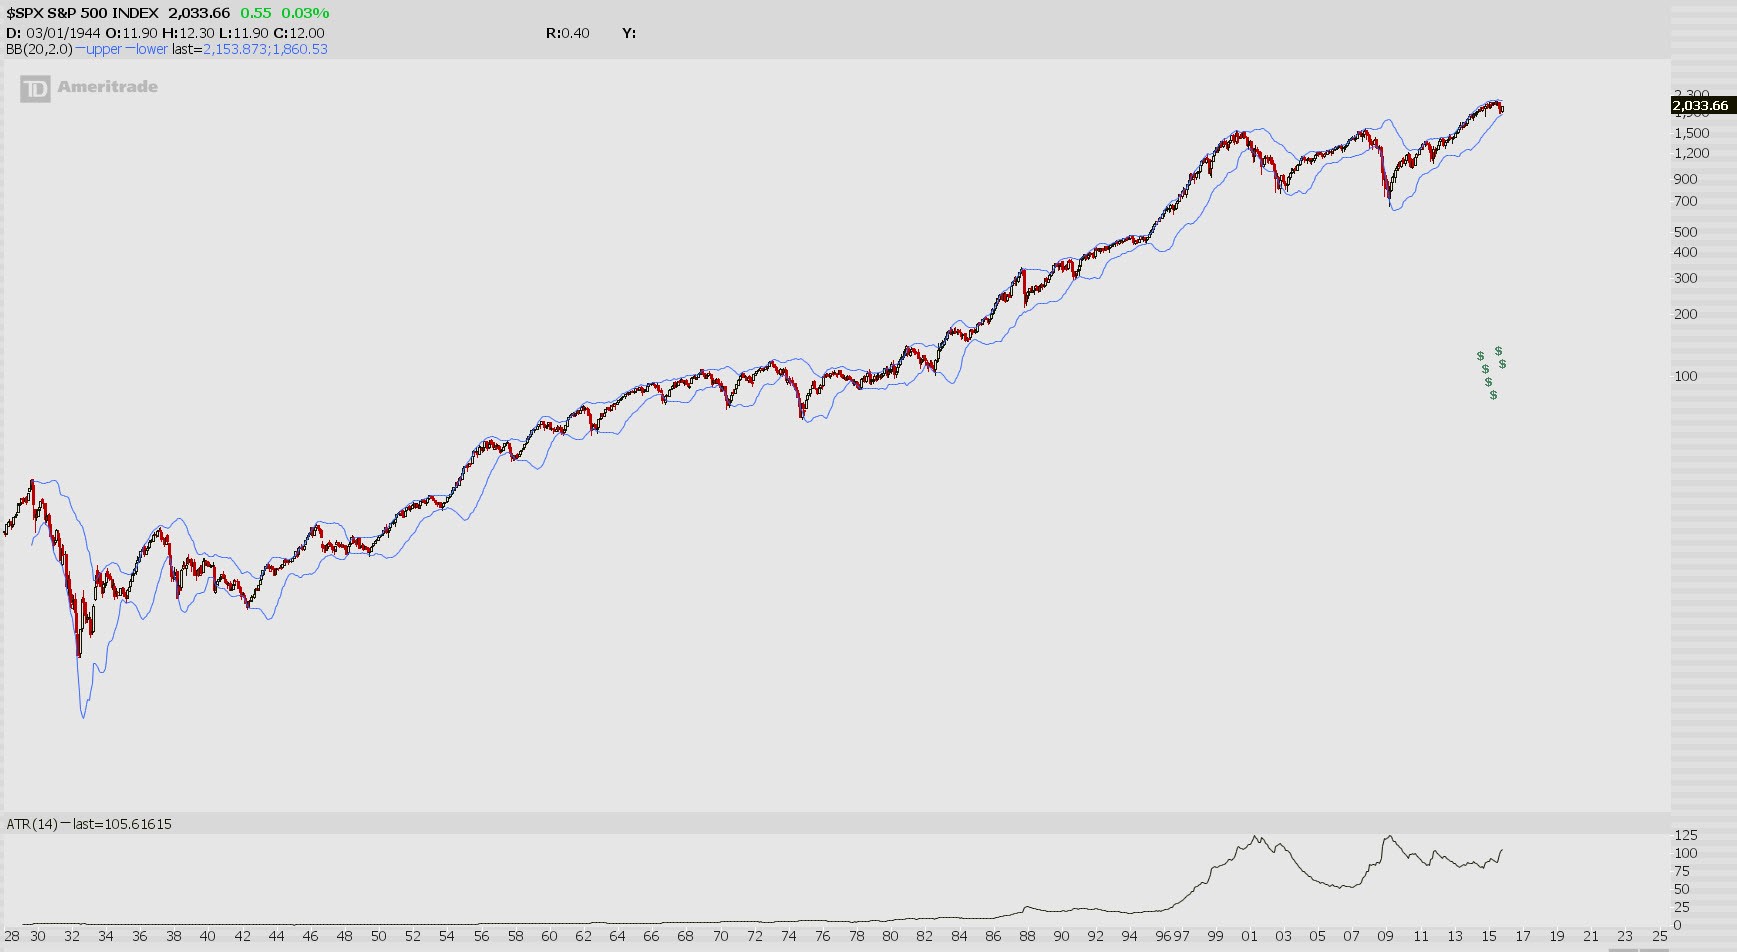
For 2016, there’s a significant amount of compression built up. Here’s a look at the monthly chart I used for the NYC presentation, and another chart that zooms in, and also adds a Bollinger Width indicator, to show you just how narrow this range really is.
Monthly chart 1928 – Current
Monthly chart 1995 – Current
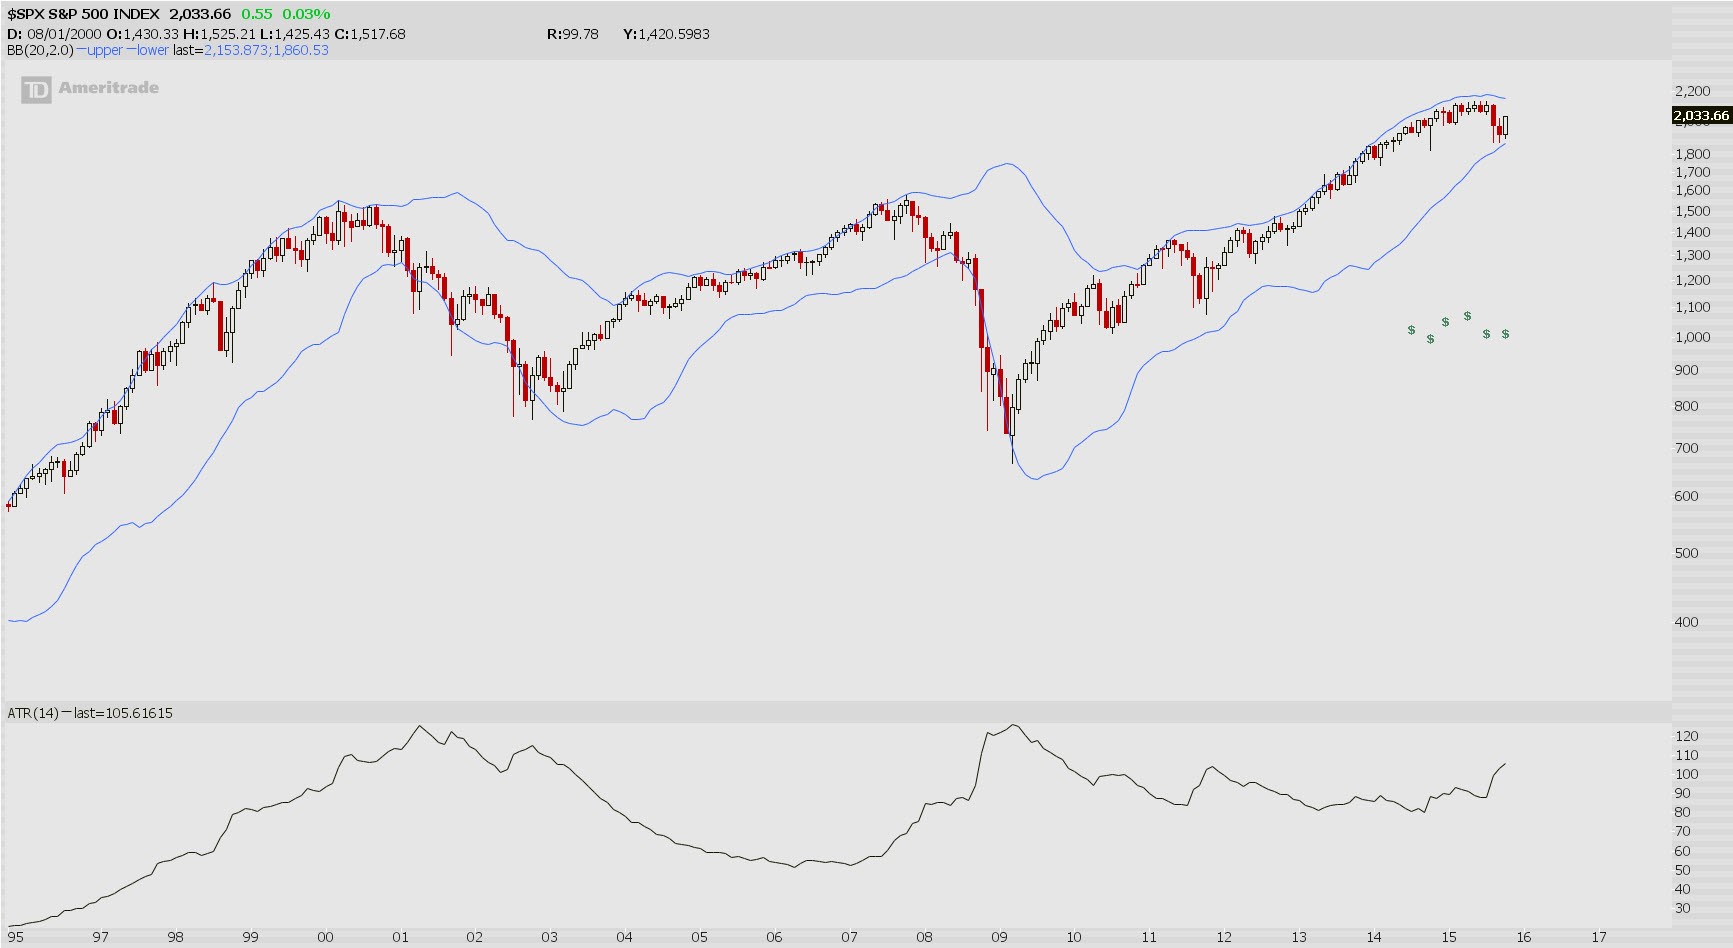
I use the bands solely for this purpose; to identify where ranges become trends and where the starting points of the sharpest market moves start. That principle helped us dial in better than most on the market set-up from August through November.
This condition on the monthly charts is pretty rare. But know this, when the range below is broken, don’t try to fight it.
If you enjoy the content at iBankCoin, please follow us on Twitter


Crickets. I think a lot has to do with sentiment, usually these indicators compliment each other in some fashion, but as you see they’re all over, http://money.cnn.com/data/fear-and-greed/
The time of the post didn’t help. I get single digits comments in the evenings.
Your right, I found it to be a chore to comment.
Lol.
I guess people didn’t want to comment, because they felt like they should guess which direction the market will go in, when the compression breaks. Since everyone’s been wrong a lot this year, people have lost confidence in their guesses.
Everyone thinks the market is going somewhere or they wouldn’t waste their time being in it. So most people lost this year. Except for the people who sold calls I guess. Except for FDN, it was a covered call market this year.
I guessed up.
But you’re right. I hate writing shit that Iimplies “up or down we go” like the rest of the homos out there.
Sorry.
No, you were brave to take a guess. My point is that no one else is that brave right now, so they didn’t guess or comment themselves.
So many folks have gotten beaten up in this market because they have been wrong in their guesses. Look at all those hedge funds with big losses that Fly writes about.
If it break up then it will break down hard first just to get everyone on the wrong side before it rips higher. So predictable.
Funny I had this same thought earlier, about the whole fake a move to make a move out of this 2 year range. Wouldn’t that be wild to see a 20% correction or something like that and then blast off?
BTW, this is something Martin Armstrong had mentioned earlier this year when was covering all of his bases. Typical doublespeak “we’re blasting off to new highs, but wait there is the possibility of a false breakdown before we slingshot higher.” I’ll see if I can find the article. Why not just admit you have no idea what’s going to happen? It’s ok Marty, your “computer” may not know everything.
If you write out pi to a trillion digits, the exact close for the day on a given day is in there somewhere, right?
….and visa versa. My bet is it breaks down because we are headed in to a bear market to the tune of a 50% drop next year. That’s what EW count is predicting, anyway.
…so that means the first move will be up and out before tanking.
Stop changing your fucking name every week.
Do you follow Caldero? He’s the only semi-accurate of the EW dudes. The rest smoke pole. He extended his forecast recently. He initially said had we gone to new highs recently, bull market over.
His forecast changed this month to match mine. Cool shit.
Ever heard of Pug? He’s pretty good supposedly.
Yes, heard of him. What’s his take?
EW is weird stuff. Why is it that all of these supposed EWave experts, supposedly following the same method, come up with different counts? If it’s just intuitive, well fine. Then don’t call it a method, just say you are following your gut.
Exactly. They’re never on the same page. It’s like the guy that quotes fibonacci lines. When you determine the anchors, the reliability falls on the artist.
I like them when they align with trendlines, volume pockets, etc., or for intraday swings. Usually you’ll get a reaction on the first touch on small timeframe swings (15-60 minute charts), so it’s good for a scalp in that respect and can give you no heat entries. But again, I prefer if it lines up with trendlines and volume even on small timeframes.
Just another discretionary tool in the art kit.
You guys see this chart of the Hang Seng floating around twitter? Global inflection point.
http://blog.kimblechartingsolutions.com/wp-content/uploads/2015/12/hangsengkissingresistancedec301.jpg
No, but we’ve been hitting these charts in After Hours for the last two months. Same setup in most every index.
Yeah I know you’ve commented on the Shanghai, etc. Really fascinating to see this 35 year trendline has held multiple times.
Seems like a wimpy way for a great bull run to end. So maybe one last hurrah first?
Seeing a lot of similarities to 94, also the last time we saw compression on these levels. If we were setting up for something similar the measured moves would be ridiculous.
@ Option Addict
Last Pug long term update
The Primary C (PC) of Cycle 2 (C2) wave headed to the 1555 to 1575 target my mid-year 2016 is underway.
https://pugsma.wordpress.com/longer-term-sp-500-view/
I use trend lines and fibs every time I make a trade but like OA said it’s just another tool. You should never blindly enter…. things have ‘align’ or the trade is a pass. However you also have to be very careful not to overload your chart as you can always find an indicator that will tell you what you want to hear.
True words.
SCO broke above 137ish in pre market. I am a buyer of any dip going forward. Currently I am slightly net short.
Natgas trying to not be finished for the year. Need European commitments to buy our gas. Will begin researching and following this development. Currently net short. Long term I am a bull, but it depends on my European thesis.
So you don’t advise holding $UWTI over the long weekend then?
I just got an additional fill on SCO at 134.55. Depends on your position size and amount at risk. I do not risk more than 1 – 2 percent of capital on a trade. With this add, I am at 1/2 of 1% at risk short oil.
After today, oil can fall and not affect the formulas used to determine the average monthly price needed to continue debt funding. Thus I believe oil is headed for 32/barrel in January
Added to SCO 128.60. Well played oil bulls today. 37.50 – 38.00 should be the final print for 2015
You don’t think OAs outlook of an oil pop up around next week timeframe will play out?. Oil looking pretty resilient last few days in light of bearish news
Oil needs to be kept elevated through the first of the month so an additional pop may occur on 1/4. After that there is little incentive to keep oil elevated until the next month. I believe the best squeeze will occur as it did in March 2015 in Feb/Mar.
Thus short term I had added to my short position today. I will not add further unless oil enters the 40s/barrel with no fundamental reason.
My timeframe for this oil trade is about 2 months.
Lol…I clear out cache and use new name. Yes follow TC and yes he has extended the bull for just a bit longer as we are still in primary wave V up. He initially called for Jan/Feb I believe. Now extended to? But the bull ends 2016 and we drop 50%
Bumped it out a year, called for 5 more waves inside a larger one.
$SQ finally broke out
Saving my remaining short oil powder should we see a move to $45. At that point, I would be liquidating my long oil hedge and adding to the short presuming there was no material fundamental reason for oil going up other than to keep the credit flowing.
Again only 3/4 of 1% position short oil. My gains in TBT & KMI should oil pull an epic squeeze earlier than I anticipate will more than make up for my timing mistake.
IMHO, oil can trade 32 – 45 at current inventory levels. The higher the price goes, the less likely WTI gets exported unless Mexico can refine it for insanely low cost and return it to the US at prices that beat our refiners.
Deciding what to do with PYPL. Underwater in Jan 40s, may roll out to Feb to include earnings since implied volatility is so low. Chart looks great, just not sure it will move in time for Jan expiration.
Year end pin it is…
Baker Hughes rig count at 1. Also Fed making Treasuries available through their overnight repo at 1:15pm, I believe. Will be watching TLT’s response.
Rig count did not move the needle for the bulls. TLT moving up towards 1:15 repo. If there is stress anticipated over the weekend, participants will gladly hand their cash over to the Fed for 25 to 50 basis points in interest.
Based on TBT moving above 44.00, probably not a lot of stress showing up via the repo auction.
These two useless data points brought to you by nocturne !!!
Happy New Year and best of luck trading oil and bonds in 2016. Should be good action for both sides.
I go into 2016 short long bonds and short oil.
I’m a bit late to party for commenting but we’re in a bear market. Can’t see any solid catalyst to drive stock valuations higher outside of more FED intervention.
You know BB’s don’t indicate direction, just compressed volatility & likelyhood of sharp price movement
lower we go into Jan/Feb
That was all the post implied, no?
Thanks for your opinion.