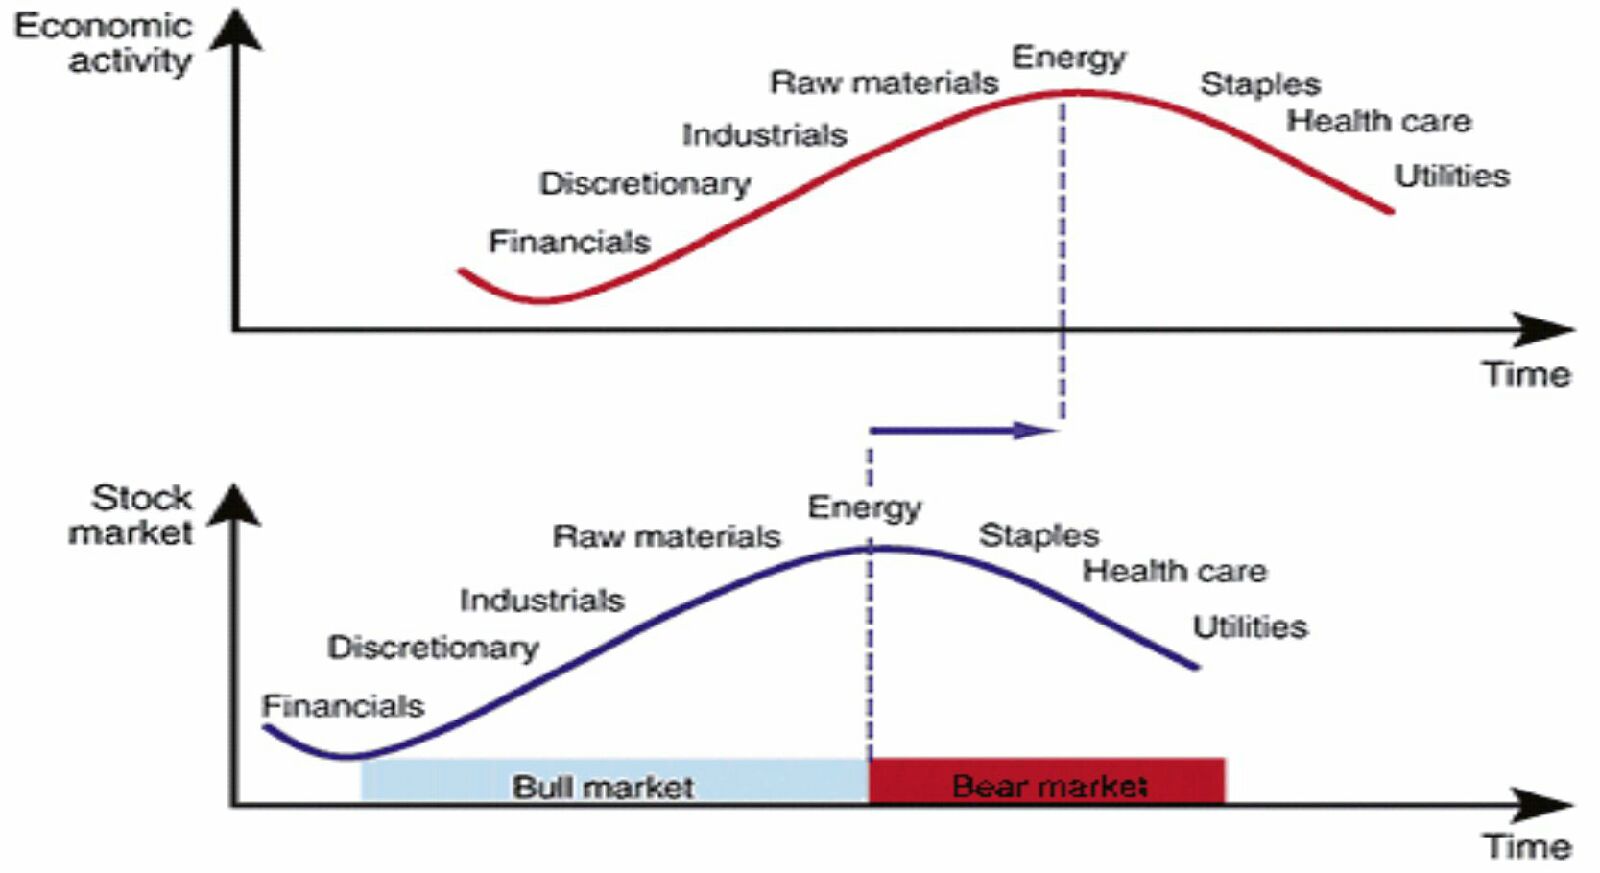
Keep an eye on this chart today, as it and the XLP are the first sectors to hit new highs/reach prior highs. When defensive sectors lead, it becomes a concern for the underlying trend.
We’ve looked at former market corrections and when these sectors reached new highs into volatile market conditions, market weakness has followed.

If you enjoy the content at iBankCoin, please follow us on Twitter


Feels like the market just needs a nudge to tip. Money seem to be moving to retail.
OA, by no means am I questioning your post or logic because I do agree with you. I’m wondering how we should interpret XLU and XLP hitting new highs, while IBB came extremely close to hitting new high yesterday. Is this one of the subtle indications we should always be on the look out for? Thanks for the advice and help.
We’ve shown in prior market tops where XLU broke out led to market weakness. Participants are positioning defensively into strength. Compare charts of 2011, 2007, etc.
Thanks for the response; always appreciate the insight, especially when it comes to taking emotions of decisions.
OA – can you see a scenario where the RUT hangs in there for say another week, or are do you already hear the diesel engine of the steamroller in the neighborhood?
These rallies can hang for some time. The last leg in 2007 took months. In 2011, weeks.
Thanks, OA. I’m looking at the oscillator, and the gummy worm still sits so low. I’m ready for anything, though…
Thanks for the tip h/t
OA – I got stopped out of TRUE earlier this morning. Do you think it’s worth a reentry here?
so did i. to the damn bottom penny. freaking stop order hunters.
goes to show you stop losses dont always STOP LOSSES. sometimes they create them.
What about selling using a trailing stop on quote when the stock is still heading up? Some of these have worked out for me.
OE
Tell me about it. Took another stab at it. We’ll see…
Mother.of.all.bull.markets — long DDD
OA
Taking a stab at BIDU 212.5 Puts here
I bought ANGI and DDD
Q4 capex did not materialize because Congress did not pass Section 179, regardless DDD will be a continued beneficiary of intersection of industry & technology. All the risk has been priced in coupled with 35% of shares sold short = BUY BUY BUY
You are both deranged
DDD looks pretty busted to me.Closed my eyes and didn’t sell TRUE.Sticking with GNRC until earnings out.
your correct – it is busted but I averaged down since it is in my long term hold category. Same with ANGI — I know it is the most hated stock but I love the service and contractor friends of mine who sign up get instant business that leads to further projects.
Watch out for Porch.com
I agree it looks pretty busted. I think CAMT and maybe ONVO you can argue trend intact.
lulu calls anyone?
Hedges are on
GOOGL weeklies here, quick stop under 545.
quicker than i thought
XLU dipping with the market right now.
the miners are about to shit the bed.
My JDST looks nice today
I grabbed TRUE Nov 20s to join y’all.
Man to me if you are not bearish buy the headlines horrible as they may be.
Took my UVXY calls off for +100%
got some(moar) SONC as has made a nice day floor. Nov$24. The choke n pukes will soar in this enviro.
Leaving my TZA on for now
same here. for now. but may be too chicken to hold overnight
Looking super scary out there sitting above the gap up yesterday. I think we fill it and scare out a bunch of longs.
thats too easy -we ramp from here
Three higher lows and off she goes….show me those DDD’s
wish I’d taken BIIB off this mornings consolidation…ripped quite nicely despite the overall market. That’s a good shakeoff from the lows.
have to watch all the things that broke first when we declined. FXI EEM USO. None of them have participated in this massive ramp up.
Picked up some Oct 5 GMCR 140 puts when it got above 147 – looking for a pullback to ~136/137.
Keep buying the dips you bunch of fucking monkeys
yup, it works until it doesn’t
OA did you say if TRUE breaks 18 get out?
If it closes beneath, not a bad place to exit…if you are looking to keep risk tight. An alternative would be to use your time and see if it holds its lows like it did this morning.
I’m holding TRUE unless it punches through it’s LOD on volume. We have six weeks of time. Good Lord. Jeff where would you recommend buying BABA on this pullback
Is RCL a valid short
gun to my head, pain trade would be for ppl to see RUT slip/close below 1100 here, only to rip tomorrow in everyones faces
A test of 1090 as support…I agree.
The pain trade is a 1,000 point down day. Margin levels are still near all time highs.
Yeah that’s pretty much worse than our discussion here. You win.
Agree or disagree…
When vix is low control R/R by letting winners run.
When vix is higher control R/R by being a bit quicker on the exit and limiting loss.
Logic is when vix is higher capital preservation is more important, and winners are less likely to enter run away trend so you have to cut losers even more quickly. You are more likely to get stopped out but get to live to see another trade.
Or maybe it’s better to not really change how you manage and just adjust position size to be less when VIX gets a bit higher. Or both.
Check this out fellas:
http://charts.stocktwits.net/production/original_28307489.jpg?1414007358
Sure looks to me like a rotation is going on. The question is whether or not Emerging markets still go down but at a slower pace or if they go up should small caps continue to fall.
Full disclosure, I added to EDC today under $25 so I’m biased.
For “Quality Control Inferno” …
From yesterday;
“The Int. A price targets we provided in the weekend update were either the 1929 pivot or the 1956 pivot. After that we expect a very sharp pullback for Int. wave B …”
Today’s high was SPX1949 (hitting the edge of the 1956 pivot by the +/-7 range) just as predicted and then we rolled over.
Here’s today’s OEW summation;
“The market opened higher today, rallied right the edge of the OEW 1956 pivot range, then started to pullback for the first time since Monday’s open. The rally from last week’s Major A low at SPX 1821 has progressed in three Minor waves: 1898-1878-1949. At today’s high wave ‘c’ was nearly equal to wave ‘a’. This may have completed Int. wave A, and a downward Int. B could be underway. Support for Int. B should arrive at the 1901 or 1869 pivots. After that we should see another three wave rally to complete Int. C/Major B. Should the market hold the OEW 1929 pivot range, there is the possibility of one more push to the 1956 pivot to form a negative short term divergence. Then Int. B would follow.”
So, you can see that the prediction is for a drop to 1901 or 1869 but Tony has “objectively” allowed for the possibility that we get support at 1929, in which case there could be a retest of the 1956 pivot before continuing down to the 1901 or 1869 pivots to complete this Int B wave. Once completed and confirmed, the a final 3 wave rally above the 1956 pivot will ensue. Once that rally is done, completing Major WaveB, we will resume the correction to new lows until Primary Wave4 is complete. Then the bull market resumes in Primary Wave5 … the final up leg in this run.
Nothing wishy-washy about that. Tony predicts but waits for confirmation before declaring the wave complete, just as he is prepping the reader for with today’s summary.
You have a chart of this? Where it draws out his scenarios?
Click on the charts page here at his blog;
http://caldaro.wordpress.com/2014/10/20/monday-update-427/
I literally couldn’t follow all that but just as I said yesterday there isn’t much predictive value there when you basically say the market could go up or down. A chart would be nice.
Ha!
It’s either scenario a or b depending on confirmation. Occasionally it gets tricky when the wave extends or does unusual formations (zigzag, flat, triangle etc) rather than basic a-b-c but Tony does a great job in getting the reader thru those with confidence.
No predictive value?
I know we are going down to at least 1900 then back to 1973 before we make the final leg down to new lows. I also know not to panic out on new lows and to go long rather than short with a final bull leg Primary Wave V to follow. What can you tell me?
Right, hard to predict… and that’s why I moved away from this long ago is that in the end I was left with two scenarios all the time – the market either goes up or down. Wave analysis makes it cool to look back on to see how it worked, but hard to predict in the moment. I have found that market profiling helped with the predictive value the most.
Your scenario lines up with my sentiment chart projections though. However, after a move to 1973 I would be reluctant to call for new lows…at least at this point. That may change in a week though, FWIW.
I agree with OA that most of the time its very difficult. However, I think at big inflection points it pays to be cognizant of a pending trend change. Most PM’s fancy themselves stock pickers but blow up their track record every cycle because they miss the turns.
By PM’s I am referring to mutual fund managers and fundamental hedge funds.
I find it very useful for CIT as Blue indicates below. For LT and Swing trading it’s another tool to help stay long, go to cash/hedges or short if need be. Certainly not as useful for ST trading in options except if buying naked calls when a major CIT is upon us. We shall see if the three Major waves down in Primary 4 prevail to new lows as they should soon enough. I put it out there as a “friend” (no homo) so you don’t find yourself in a bull trap, though you are a skilled trader and certainly don’t need my advice … hence I will no longer post updates as you know where to find them if so inclined.
No, I appreciate these…which is why I asked for a chart. I’d appreciate your interpretation on these as a good count does help you to make sure you see the longer term picture. Sorry if my comments made you feel that this wasn’t appreciated.
I do appreciate and believe in the “fractal” market aspect of Elliot wave and Prechter stressing the sentiment aspect of it.
I think there is some value in it for people with all three traits of incredible imagination/creativity, meticulous planning/organization, and good math/statistical skills and an actual cultivated skill.
I read of people that have success exclusively trading the 3rd wave of the count. Makes sense to me because the upside is more. You don’t have to be right about the count more than 50% of the time if you are aiming for wave 3 or iii or III or however it is denoted, and you don’t have to be overwhelmed with rules to explain exceptions and zigzags. You can just focus on basic count. Just know when it invalidates the 3 and measure target as greater than the length of the 1 count at minimum.
I think the sentiment chart is in many ways an Elliot wave. But it is a lot cleaner for me personally to read as sentiment chart.
You have wave:
1)discouragement to wall of worry
2)to aversion
3)to returning confidence
4)to buy the dip
5)to enthusiasm
Then I think ABC wave to discouragement where it starts again.
I could never have the organization to map all the possible counts out and be flexible enough to adapt on the fly and adjust the count and know all the rules in which count is invalid and the extensions, flats, zigzags,etc.
But finding “aversion” AKA stocks that are likely to enter wave 3? That also match up huge with gameplan of finding good R/R? Sign me up.
I havent been involved very much last few months but wondering if anyone is noticing life in the pot stocks? Last week NVLX and seems this week MJNA and HEMP. Just wondering if there’s fire behind the smoke…
mine haven’t much of a heartbeat. I’m hoping someday euphoria will hit again, and they’ll spark…but I think it will take more legislation or a firm bull run to make any significant gains in this space.
Earnings reports look great , Ebola scare seems to be waning , dovish Fed speak , oil prices stabilizing , Putin behaving , hedge funds needing to play catchup and most importantly a strong end of year seasonality . Certainly there will be some minor bumps along the way , however , our proprietary algorithmic cash flow volume pocket thingy with several PPT thingys calls for a yearend DJIA of 19000 and an S&P 2000 . No one on the planet is making this prediction except MRBIG . You’re welcome .
Is this a great country or what ????
mother of all bull markets
Glad I sold my UVXY yesterday and didn’t hold over night. Whew!..,lol
OA and all, XLU is currently in the red (albeit barely), but my take away for the moment is that it’s lagging the overall market, with the Russell plowing through. Interesting times indeud..
It’s the only sector at new highs for the year. XLP not far either. This has been a signal to watch in every market turning point.
Good call, can’t argue with facts. I’ll be cognizant of that and keep it in the back of my mind when determining the time frame of my longs. Thanks for the response and the hard work!
That’s my only point is that in the past, this exact same set-up has mattered. Volatility (ATR) explodes, XLU/XLP breaks out, markets roll over.
Again, it can go overlooked, but is has mattered in the past on so many occasions.
If we could continue higher, I really like the way your BLOX call from earlier is setting up..you still in?
Yes, I’m there.
If only Elliot Wave had words to describe the phrase that was in instead of 5 different ways to count to 5 and all the letters of the alphabet and roman numerals denoted by letters 1/I/i/ⅰ/I/Ⅰ/╪/╠ might not be so confused by it.
1F only Ⅰwas smarter i could get it. ⅰmight sΘme day. Then ít m┌ght be ♂nterest╣ng enough█
it’Σ all Γ ρεεκ to me βut ψhατεvερ