Per reader request, here is my method on how to acquire intra-day $NYMO readings.
You might laugh about how simple this is, but here it is. On my charting platform, which I am embarrassed to confess is Prophet, I have added the study “McClellan Oscillator.” This tool is calculated much different than the $NYMO on stockcharts, which is a ratio adjusted version that prints values EOD.
However, the Prophet version (MOSC) is calculated throughout the day, and adjusts as the number of advancing issues less the number of declining issues on the NYSE changes throughout the day. While the MOSC moves intra-day, I look for prior reference points that I can use as a reference. Using a 2yr chart, I can see that the current intraday reading aligns with the same reading as of September 22, 2011. 
I take those two points and compare them on stockcharts…
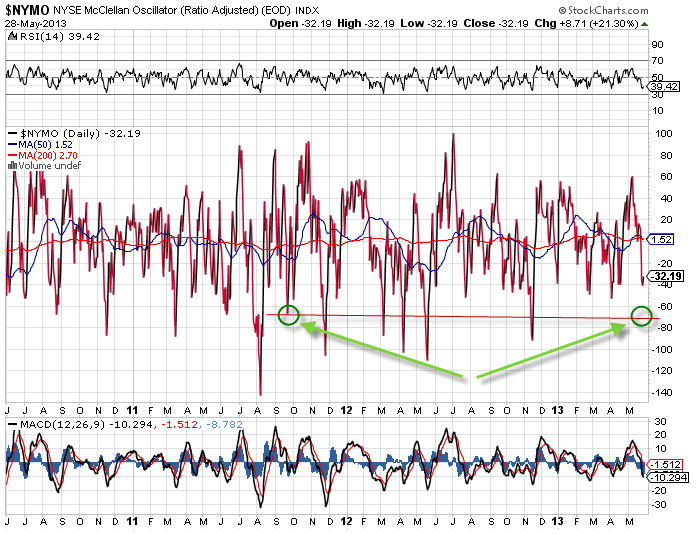
As you can see, according to stockcharts, that EOD value on 9/22 was -70. We are currently sitting at that same value. This might change through the remainder of the trading session, but it pays to know where things are, so you can anticipate what will happen next.
For the record, I give myself +/- 2 points of error when gauging these readings, and it has never failed.
OA
If you enjoy the content at iBankCoin, please follow us on Twitter


Looking at the SPX chart you have this would be the shallowest correction over that time period if we hit that -70 level today. What does that indicate I wonder? Heavy distribution? Thoughts?
Strong market.
http://www.mcoscillator.com/books_dvds/#patternsforprofit
Ever read the source material? Worth it?
Pass.
Just use the indicator. You’ll receive less marketing emails that way.
One trade today. DECK calls earlier, fwiw.
Jun 57.5 $.70
How do you decide when to exit your trades?
When they hit my target, or when they move in a manner that suggests my plan was wrong.
Help me understand, Sir — why look at the Sept 2011 low, in particular, and not all those other lows in MOSC?
They were the same price point. The others were not.
Its like drawing support. Find the exact same touch point, find out the price.
TC providing another chance to get in
Love that stock.
How does Bidu look to you? You still have the weekly calls?
Still have them. Look at a 20 minute chart. Looks a-ma-zing.
Thanks
Wlt chart looks like it’s breaking-down
Are you anxious?
Picked up RVLT…tempted on DDD.
amazing
Alert triggered, quick to strike.
Been watching that thing for weeks.
Was the alert price only? Or Volume alert only? both? What caused you to set the alert in the first place? Did you go through a specific screen to find it? What (price?) did you set the alert at? Did you consider buying it on may 15th when pattern was decent and price was around the same? Did you adjust the price of the alert as the pattern developed to get a lower buy point? Would you ever set an alert, and not buy it if the buying volume isn’t there? Do you still buy stocks at support in anticipation of breakout? Would you ever consider it in this example at $3.35?
Could you make a quick blogpost on these sorts of things?
I set alerts on stocks in my watchlist. Price alerts, at prices that commit to upside.
Holy shit, btw.
thanks
Super useful.
Thank you, sir.
OA, thoughts on FWLT?
Wish I had something for you on this one…
What are you thinking? Long? Story or set-up?
Sorry, replied below on accident. B game. In regards to FWLT….Looks like it has been flagging and I like today’s candle. A quick pop to try to take out that recent high at 24.50?
Here are my ideas
AFFY for the Pennant pattern coiled tight with massive upside…
DDD- bull flag or cup+handle.
CIEN,WPRT-similar look. Coiled on weekly, inverse head and shoulders on daily near.
High Short interest sets I like:
AFFY(see above)
PETS
VNET
ATLC
2 more:
Soda
RNF – coiled. Probably like it better as a short…
My “bottom packers” screen had over half the names popping up that were gold or silver miners.
Miners:Aumn,gpl,vgz,urre (uranium),anv,svm,aem,ag,akg, ego,fsm,gdx,gdxj,gfi,hl,iag, ngd,pvg,rby,pzg,sa,ssri, svlc,trx,rgld
Non-miners:Actv,eng,txcc,hxm,trit,clsn,mm.
Looks like it has been flagging and I like today’s candle. A quick pop to try to take out that recent high at 24.50?
Ok, I can see that. Not a bad set-up…
She workin so far!