iBankCoin
Joined Nov 11, 2007
31,929 Blog Posts

The Black Swan Index Notches Higher

“Where some investors see nothing but rolling green fields and placid summer lakes, others see black swans circling high above.

Such is the picture painted when comparing the widely followed Chicago Board Options Exchange Volatility Index—the market’s “fear” gauge— and its sister measure, the Skew, aka the “Black Swan Index,” which charts, well, lots of fear. (The black swan is a metaphor for a highly unusual occurrence and took on added significance in the market following Nassim Taleb’s 2007 book, “The Black Swan.”)

While the VIX is closing in on historic lows and has tumbled nearly 20 percent year-to-date— meaning there is a high level of complacency among investors— the Skew has surged in June, rising more than 12 percent for the month.

Taken together, the two measures reflect an interesting dichotomy among investors.

One crowd, buying plain-vanilla VIX options, anticipates a smooth ride, while the other is not necessarily anticipating but at least bracing for not just an ordinary market disruption—say, a weak economic number or one-off geopolitical event—but something really off the wall happening and knocking the seemingly indestructible stock market for a major loop.

“It’s just up like a hook for the whole month of June,” said Catherine Shalen, the CBOE’s director of research. “What’s happening is that in spite of the fact that everybody says the VIX is low and the market is complacent, the market is not complacent in every way. This is telling us that some investors who trade in options believe that the probability for a sharp, three-standard-deviation move has increased.”

The VIX measures near-term or next-term options whose price targets have not been hit—called “out of the money”—and its long-term average is around 20, as opposed to the 11 where it traded Tuesday. The Black Swan, or Skew, uses an options formula to gauge risks greater than the VIX. A reading of 100 indicates little risk of “fat tail” or highly unusual events; the index is now trading around 139 and was at 143 Friday, its second-highest level ever…..”

Full article 

Comments »

GDP Falls 2.9% at an Annualized Rate

The U.S. economy contracted in the first quarter by the most since the depths of the last recession as consumer spending cooled.

“Gross domestic product fell at a 2.9 percent annualized rate, more than forecast and the worst reading since the same three months in 2009, after a previously reported 1 percent drop, the Commerce Department said today in Washington. It marked the biggest downward revision from the agency’s second GDP estimate since records began in 1976. The revision reflected a slowdown in health care spending.

Consumers returned to stores and car dealerships, companies placed more orders for equipment and manufacturing picked up as temperatures warmed, indicating the early-year setback was temporary. Combined with more job gains, such data underscore the view of Federal Reserve policy makers that the economy is improving and in less need of monetary stimulus.

The first-quarter slump is “not really reflective of fundamentals,” said Sam Coffin, an economist at UBS Securities LLC in New York and the best forecaster of GDP in the last two years, according to data compiled by Bloomberg. “For the second quarter, we’ll see some weather rebound and a return to more normal activity after that long winter.”

Durable Goods

Another report showed orders for business equipment climbed in May, showing corporate investment is helping revive the economy after the slump at the start of the year. Bookings for non-military capital goods excluding aircraft rose 0.7 percent after a 1.1 percent drop in April, according to the Commerce Department.

Demand for all durable goods — items meant to last at least three years — decreased 1 percent, reflecting declines in the volatile transportation and defense categories…..”

Full report

Comments »

NAR Report Not So Bullish: The Über Wealthy Prop Up Yesterday’s Housing Report

“A month ago we showed a chart that, in our humble opinion, summarized all that is wrong with the US housing market. The chart in question showed the April breakdown of existing home sales on a Y/Y basis by pricing bucket.


Needless to say, what the chart showed was the symptomatic, and schizophrenic, breakdown of US housing into two camps: the housing market for the 1%, those costing $750K and above, where the bulk of transactions are mostly between non-first time buyers, and typically take place as all cash transactions, and the market for “everyone else” which continues to deteriorate.

Moments ago the NAR released its May data, which on first blush was widely lauded as bullish: the topline print came at a 4.9% increase, rising from 4.65MM to 4.89MM, above the 4.74MM expected. Great news… if only on the surface. So what happens when one drills down into the detail? As usual, we focused on the last slide of the NAR breakdown, located at the very end of the supplementary pdf for good reason, because what it shows is hardly as bullish.

So how does this “housing recovery” in which the NAR has proclaimed the “sales decline is over” look on a granular basis.

The answer is below, and it is even worse than the April data. It also explains why first time buyers have dropped to even further cycle lows of just 27%, down from 29% both a month and year ago.

This is bad because while in April there was a modest increase sales in house buckets from $250 all the way up to $1MM +, in May the only bucket that had an increase in sales from a year ago was that exclusively reserve for the ultra-richest….”

Full article 

Comments »

$GS Presents 15 Cheap Stocks for an Expensive Market

Compustat, I/B/E/S, FirstCall, Goldman Sachs

Even if the week didn’t start with the bang it ended with last week, the “this-market-is-looking-expensive” chatter will not be put down against the backdrop of a dovish Fed and an S&P 500 SPX -0.01% that has 22 record closes under its belt for the year so far. (The current bull market still has a below-average number of highs, read on.)

Goldman Sachs, for one, doesn’t see much standing in the way of more stock-market gains. In a note to clients on Friday, chief U.S. equity strategist David Kostin and his team said they expect the S&P 500 to grind up over the next two-plus years as earnings growth continues, and rolling forward their 12-month price target to 2,000 — 2,100 in 2015 and 2,200 in 2016 are further-out targets. (Note that of the most bearish Wall Street analysts, Deutsche Bank’s David Bianco also thinks stocks are looking pricey, but doesn’t see the S&P 500 reaching 2000 until end 2015.)

From Goldman comes the question and answer of how to find a happy meeting place at the intersection of value and growth.

Goldman Sachs

The forward p/e ratio for the S&P 500 is at 16.5, an 18% premium to the average seen during similar real interest-rate environments of 1% to 2%, notes Kostin. The average seen since 1976 is 13.5 times along with real interest rates of between 1% and 2%. And margins have also stagnated at a record high level since 2011….”

Full article

Comments »

Study: 26% of Americans Have No Emergency Savings, Most are Asset Rich and Cash Poor

“About 26% of Americans have no money saved to handle emergencies, according to a new poll that showed households making little progress over the past year in their ability to deal with financial trouble.

The Bankrate.com survey results released Monday also found that two-thirds of respondents said they have less than the recommended six months’ worth of readily available savings to cover living expenses, such as rent or mortgage payments, utility bills and food costs, in case of a lost job or other difficulties.

Both figures were only slight improvements from Bankrate.com’s survey last year, which found that 27% of respondents had no emergency savings and that 71% didn’t have enough to last six months.

“Americans continue to show a stunning lack of progress in accumulating sufficient emergency savings,” said Greg McBride, chief financial analyst for the financial information website.

About a third of respondents — 34% — said they were less comfortable with their savings than they were a year ago. Just 18% said they were more comfortable.

The struggle to build an emergency fund came even though the personal savings rate calculated by the Commerce Department has doubled from a record low of 2% in 2005 during the subprime housing market boom to 4% in April….”


Full article

Comments »

Fed’s Plosser: We May Need to Raise Rates Sooner Than Expected


“The U.S. economy is approaching the Fed’s economic targets faster than expected and might push the central bank to accelerate plans to increase interest rates, Philadelphia Federal Reserve Bank President Charles Plosser said on Tuesday.

Plosser said he had increasing confidence in economic growth, and addedthat inflation was trending higher and unemployment likely to fall faster than many of his central bank colleagues project.

“The current data suggest economic strength is fairly broad-based,” Plosser, who is a voting member of the Fed’s policy-setting committee this year, said in morning remarks at the Economic Club of New York.

While he supported the Fed’s most recent policy statement, which seems to place an initial interest rate increase sometime next year, Plosser said he had “growing concerns that we may have to adjust our communications in the not-too-distant future. Specifically, I believe the forward guidance in the statement may be too passive.”

Using different variations of what is known as the Taylor Rule, for example, Plosser said the current economic projections of Fed officials would produce a target interest rate of anywhere from 1.5 percent to as much as 4 percent by the end of next year—higher than that currently expected by most policymakers. Depending on economic conditions, the appropriate rate could even be as much as 4.7 percent…..”

Full article

Comments »

Mohamed El-Erian Sees a Trio of Problems for Europe


“There is a specter haunting Europe: a trio of economic problems that threaten the continent’s prosperity and social stability, all of which revolve around the notion of the “One Percent.”

Similar to many other parts of the world, Europe’s first One Percent challenge involves the relative and absolute enrichment of an already fortunate class — the one percent who are Europe’s wealthiest citizens. The One Percent problems are the possibility of too many years of anemic economic growth of about one percent and “lowflation” — or an inflation rate that hovers around one percent.

Combined, this One Percent Troika translates into the persistence of excessively high unemployment and a damaging debt burden, accentuating what the European Central Bank president, Mario Draghi, has already described as a fragile and uneven recovery. And the longer this persists, the greater the damage to Europe’s political and social well-being.

All of this is the result of both history and current policies. With the notable exception of Germany, most countries have dragged their feet in implementing reforms to spark economic growth and create jobs. The situation has been further aggravated by an unbalanced economic and financial policy stance that favors those who already control substantial financial assets over the needs of average workers.

Given how close Europe was two years ago to financial fragmentation and economic implosion, some may be tempted to think that the One Percent Troika is not that bad after all. Worsening inequality is tempered by Europe’s welfare system; one percent growth is better than the recession that the region recently experienced; and stable lowflation is not as harmful as outright deflation or unanchored inflation.

It could also be that this troika is sustainable for a while…”

Full article

Comments »

US State Department Witlessly Confirms Right Sector Nazis are Operating in Eastern Ukraine


“The Interpreter Magazine is a “special project” of the Institute of Modern Russia. By “Modern Russia,” its creators mean, Russia as imagined by Wall Street and London. The “institute” is run by disgraced Russian billionaire oligarch, convicted criminal, and long-time Western proxy Mikhail Khodorkovsky, his son, and Washington lobbyists. It includes contributors such as Catherine A. Fitzpatrick who literally worked for the US State Department’s propaganda arm, Radio Free Europe/Radio Liberty and convicted financial criminal George Soros’ faux-rights advocate Human Rights Watch (HRW) and Soros’ Open Society Institute itself.

The Interpreter is overtly a clearinghouse for anti-Russian propaganda and ceaselessly promoted by corporate-funded and directed faux-rights advocates like the Neo-Con lined National Endowment for Democracy (NED) and Freedom House – both of which are funded and perpetuated by the US State Department itself.

In an entry titled, “Russian Defense Ministry Apologizes For Lying About White Phosphorus,” we discover the degree to which The Interpreter is propaganda. Upon reading the entry, we find out that the Russian Defense Ministry did no such thing as “apologize.” Instead, what is described is a war crime committed by Neo-Nazi Right Sector militants working on behalf of Kiev’s “Security Service of Ukraine” (SBU). Right Sector captured the journalists, interrogated them, and coerced a confession from them. Right Sector then simply claimed they worked for the Defense Ministry and their coerced confession constituted a formal apology for “lying,” before handing the captured journalists over to Kiev’s SBU.

The entry claims:

“Then a video of one of the detained reporters, Evgeny Davydov, appeared on pro-Kiev media, showing him confessing while he was still in captivity that he was forced to put in false information by editors in Moscow, and that in fact he wasn’t even in Slavyansk when the broadcast was edited and had obtained no footage from the town.”

The entry then admits:

“The two correspondents from Zvezda, a TV channel of the Russian Defense Ministry, Davydov and Nikita Konashenkov had been detained 14 June outside Slavyansk, reportedly by Right Sector militants who transferred them to the Ukrainian Security Service (SBU) where they were investigated on suspicion of espionage.”

Far from proving or disproving the use of white phosphorus in eastern Ukraine, the propaganda stunt instead illustrates that Nazi Right Sector militants are still operating in eastern Ukraine, taking journalists hostage – a serious crime – and working directly with the regime in Kiev. Regarding the alleged use of white phosphorus, RT’s report and Russian officials themselves clearly call for an investigation, and nothing more. And while the use of white phosphorus is being contested by Western media houses, the aerial and artillery bombardment of populated regions in eastern Ukraine is confirmed, and ongoing…..”

[youtube://http://www.youtube.com/watch?v=JzCcBbP1VjA#t=144 450 300]

Full article 

Comments »

Move Along, Nothing to See Here: Business as Usual in America

“WASHINGTON, DC – From the Chesapeake Bay to the Great Lakes to the Puget Sound, industrial facilities dumped more than 206 million pounds of toxic chemicals into America’s waterways in 2012, according to a new report by Environment America Research and Policy Center. The “Wasting Our Waterways” report comes as the Environmental Protection Agency considers a new rule to restore Clean Water Act protections to 2 million miles of critical waterways across the nation – a move bitterly opposed by the lobbyists for corporate agribusiness, including the American Farm Bureau.

“America’s waterways should be clean – for swimming, drinking, and supporting wildlife,” said Ally Fields, clean water advocate with Environment America Research and Policy Center. “But too often, our waters have become a dumping ground for polluters. The first step to curb this tide of toxic pollution is to restore Clean Water Act protections to all our waterways.”

Based on data submitted by polluting facilities themselves, the group’s report uses information from the EPA’s Toxics Release Inventory for 2012, the most recent data available. Major findings of the report include:

• Our nation’s iconic waterways are still threatened by toxic pollution – with polluters discharging huge volumes of chemicals into the watersheds of the Great Lakes (8.39 million pounds), the Chesapeake Bay (3.23 million pounds), the Upper Mississippi River (16.9 million pounds), and the Puget Sound (578,000 pounds) among other beloved waterways.
• Tyson Foods Inc. is the parent-company reporting dumping the largest discharge of toxic chemicals into our waterways, with a total of 18,556,479 lbs – 9 percent of the nationwide total of toxic discharges. Of the top ten parent-companies by total pounds of toxics released, four are corporate agribusiness companies (Tyson Inc., Cargill Inc., Perdue Farms Inc, and Pilgrims Pride Corp.).
• Corporate agribusiness facilities, the report also finds, were responsible for approximately one-third of all direct discharges of nitrates to our waterways, which can cause health problems in infants and contribute to “dead zones” in our waters. For example, pollution in the Mississippi River watershed has contributed to the massive dead zone in the Gulf of Mexico….”

Full report

Comments »

State of the Union: The Crumbling of America

“No state is needier than West Virginia when it comes to fixing crumbling highways, airports and water works, with annual repair needs of $1,035 per resident that’s three times the national average.

Yet even with borrowing costs hovering close to four-decade lows, lawmakers rejected a January proposal to sell $1 billion of bonds to repair roads that run through the Appalachian Mountains. Budget cuts were a more immediate concern, they said.

Across the U.S., localities are refraining from raising new funds in the $3.7 trillion municipal-bond market after the worst financial crisis since the Great Depression left them with unprecedented deficits. Rather than take advantage of Federal Reserve policy that’s held benchmark interest rates at historic lows since December 2008, they’re repaying obligations by the most on record.

“When you’re trying to be frugal, it’s probably not the time to eat caviar,” said Margaret Staggers, head of West Virginia’s House transportation committee, who said she was unable to persuade Democratic colleagues to support the bond plan.

The legacy of the 18-month recession that ended in June 2009 still looms large for America’s states and cities. While revenue has revived, governments are under pressure to increase funding for education and other services after years of cuts. They’re balancing those needs against required payments toward entitlements such as pensions, having set aside $1.4 trillion less than they’ve promised to retirees, according to Fed data.

Pennsylvania Hangover

“There’s a psychological hangover,” said Uri Monson, chief financial officer of Montgomery County, Pennsylvania, outside Philadelphia. “We’re not going to go out and borrow unless we absolutely have to.”

Issuance this year has tumbled to $123 billion nationwide through June 13, down 20 percent from the 2013 pace, according to data compiled by Bloomberg. It’s also 30 percent below levels seen in 2010, the final year of the federally subsidized Build America Bonds program, which was designed to spur infrastructure investment.

Since 2010, states and localities have lowered their bond load by $111 billion, the most since the Fed began keeping records in 1945. They’ve paid down the liabilities even as yields on 20-year general obligations have averaged 4.25 percent in the five years since the recession, the lowest since 1969, according to Bond Buyer data.

Corporate Contrast

In contrast, Apple Inc. and Verizon Communications Inc. have led investment-grade companies selling $648 billion of dollar-denominated debt this year, a record pace, Bloomberg data show. The 3.05 percent yield on the Bank of America Merrill Lynch U.S. Corporate Index is within 0.4 percentage point of an all-time low reached in May 2013.

States’ and localities’ spending on construction has fallen every year since its 2009 peak, declining $39 billion, or 13 percent, over the period, U.S. Commerce Department figures show. Their investments in roads, schools and office buildings account for the smallest share of the economy since at least 1947.

“Infrastructure is one of the only ways that states and local governments directly affect commerce in the United States — the trucks have to use the roads and bridges, the boats have to use the ports,” said Daniel White, an economist with Moody’s Analytics in West Chester, Pennsylvania.

“If we continue to let them deteriorate, it could have disastrous consequences,” he said.

Peak Days

State and local spending on roads, railways and other infrastructure crested as a share of the economy during the post-war population boom. In the first quarter, the expenditures accounted for 1.4 percent of the economy, less than a third of the 1967 level, according to data compiled by Moody’s Analytics.

America’s governments would need to spend about $3.6 trillion through 2020 to put everything from roads and water to sewers and electricity networks into adequate shape, according to the American Society of Civil Engineers, based in Reston, Virginia. That’s about $1.6 trillion more than governments are expected to dispense.

“We are not investing adequately in maintaining our infrastructure,” said Joshua Schank, president of the Eno Center for Transportation in Washington. “We are missing an opportunity to borrow at lower rates in order to do it.”

Governments aren’t avoiding the market altogether. Municipalities routinely borrow billions of dollars each week for public works….”

Full article

Comments »

G77 Advances Global Currency and Governance With Anti West Sentiment to Boot

“A collection of over 100 of the world’s communist, Islamist, and socialist tyrants, along with some elected but mostly corrupt Third World regimes, gathered in Bolivia at the G77 plus China summit to demand what they called a “New World Order to Live Well.” United Nations boss Ban Ki-moon joined the anti-American, anti-freedom, anti-national sovereignty, anti-free market festivities, calling on the assembled rulers — the biggest bloc at the UN — to keep pushing “sustainable development” and global-warming alarmism with the goal of foisting global governance on humanity. Despite its significance, the historic 50th anniversary G77 summit went largely unnoticed in the establishment press.

In their final declaration, signed by more than 130 rulers from around the world, the regimes called for what amounts to global tyranny, central planning, and massive wealth redistribution from Western taxpayers to oppressive Third World governments. Everything must be in “harmony” with “Mother Earth” under a “sustainable” UN “international climate change regime,” they said. From a stronger UN better able to implement its “mandates” to empowering the UN General Assembly as an “emblem of global sovereignty” and advancing aglobal reserve currency run by the IMF, the radical screed demands a dramatic planetary transformation.

“We fully respect the principles and purposes of the Charter of the United Nations and international law, particularly as they relate to equality among States,” the regimes said in the final agreement, calling for the “strengthening” of the UN for a wide variety of purposes. “We recognize that the United Nations needs to improve its capabilities and capacities to fully implement its mandates and to ensure the effective delivery of its programs in the social and economic development fields.” The agreement, dubbed the “Declaration of Santa Cruz: For a New World Order for Living Well,” also called for empowering the despot-dominated UN General Assembly to be a sort of veto-proof planetary legislature…..”

Full article

Comments »

Wilbur Ross: The Ultimate Bubble to Blow Up is Sovereign Debt

“A bubble currently brewing in sovereign debt will likely burst in the next couple of years, U.S. billionaire Wilbur Ross warned on Monday.

“I’ve felt for some time that the ultimate bubble, when we look back a few years from now, is going to be sovereign debt, both U.S. and other, because it’s way below any sort of reversion to the mean of interest rates,” the distressed debt investor told CNBC.

“If you look at where the U.S. 10-year had averaged over the 10 preceding years, it’s around 4 percent. If it reverts back to that level at some point there will be terrible losses in the long-term Treasury market and those will probably be accentuated in other areas of fixed income.”

Ross argued that slowing issuance of assets like mortgage-backed securities and long-term Treasurys post-credit crisis, had helped to insulate the market from the full impact of the Federal Reserve’s gradual slowdown of quantitative easing – a process known as tapering.

Investors have to “build in refinancing risk” when buying assets at the moment, he said….”

Full video article 

Comments »

Euro-zone Manufacturing & Services Survey Signals a Weakening Economy

“Euro-area manufacturing and services activity weakened in June amid a further slowdown in France’s economy, underscoring the fragility of the recovery in the 18-nation region.

A Purchasing Managers Index for both industries slipped to 52.8 in June from 53.5, Markit Economics said today. That’s the 12th month the gauge has exceeded 50, the mark that signals expansion. Economists predicted a reading of 53.4, according to the median of 25 estimates in a Bloomberg News survey. A measure of Chinese manufacturing rose to a seven-month high.

The euro area is struggling to sustain a recovery that received a bleak assessment from the International Monetary Fund on June 20. Earlier this month, the European Central Bank introduced a negative deposit rate, announced targeted loans to stimulate lending and held out the prospect of asset purchases to stoke growth and inflation in the region.

“The pace of recovery is slowing down,” said Martin van Vliet, senior economist at ING Groep NV in Amsterdam. “The further weakening of the PMI vindicates the ECB’s recent decision to implement further monetary easing.”

The euro dropped 0.1 percent today and traded at $1.3582 at 10:55 a.m. Frankfurt time. The Stoxx Europe 600 Index is down 0.6 percent at 346.15.

Chinese Manufacturing

In China, a preliminary factory PMI from HSBC Holdings Plc and Markit rose to 50.8, exceeding the 49.7 median estimate of analysts surveyed by Bloomberg News, and a final reading of 49.4 in May.

The euro area’s manufacturing gauge fell to 51.9 in June after 52.2 in May, and the measure for services eased to 52.8 from 53.2.

“Hopefully the recent stimulus measures from the ECB will help revive growth again……”

Full article

Comments »

Is a Financial Crash of the World’s Monetary System Inevitable ?

“In an excellent video presentation, Claudio Grass, Managing Director at Global Gold Switzerland, explains why a crash of the financial and monetary system seems inevitable. The presentation covers all actual issues like currency wars, rigged markets, central bankers’ interventions, statistics manipulation, monetary mismanagement and financial repression. Claudio Grass does a great job “connecting these dots” but in a factual way. In this article, we collect several quotes and graphs. The full video presentation is 22 minutes long. Readers are highly recommended to watch the full presentation and subscribe to receive three exclusive reports for free on http://welcome.globalgold.ch.

Claudio Grass explains that what we learn from history is that money doesn’t come into existence by force or legislation. It is in essence a market process; where participants decide freely which medium they want to use. It has to be easily recognizable and transportable. It has to be rare so it can’t be easily reproduced and so it can act as a store of value. Gold and silver fulfill these criteria, have an intrinsic value and are free of any counterparty risks. Therefore, it is clear why historically they were the most wide spread medium of exchange used over a time period of over 5000 years.

Even the USD became the world currency reserve because it used to be a property title for a certain amount of gold , now it is just a debt security. The Dollar as well as all other currencies worldwide have transformed from an “I-own-something” to an “I-owe-you”. Because we believe that history rhymes we are certain that the Dollar and all the other paper-money systems are going to collapse eventually.

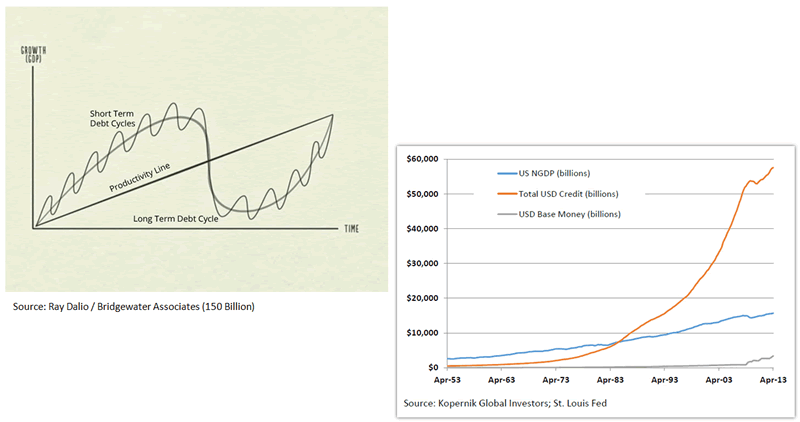
The chart on the left hand side below comes from Ray Dalio from Bridgewater Associates. He believes that we are close to a collapse of the current long term debt cycle. He also believe that we are at the top of a long-term debt cycle, therefore it is likely that we will see some deflationary shocks in the future. However, it is our understanding that central banks will try everything to avoid this by printing money to cover up the current problems which will lead to hyperinflation in the coming years. A deflationary collapse would be a “Black Swan Event” which become more probable the more the system is centralized.

The chart on the right shows that the debt and the financial system have been completely decoupled from the real economy. It also shows that our current credit based paper monetary system induces excessive credit, which can be seen from the fact that credit has increased exponentially since the gold window was closed.

Debt cycles and debt vs the real economy

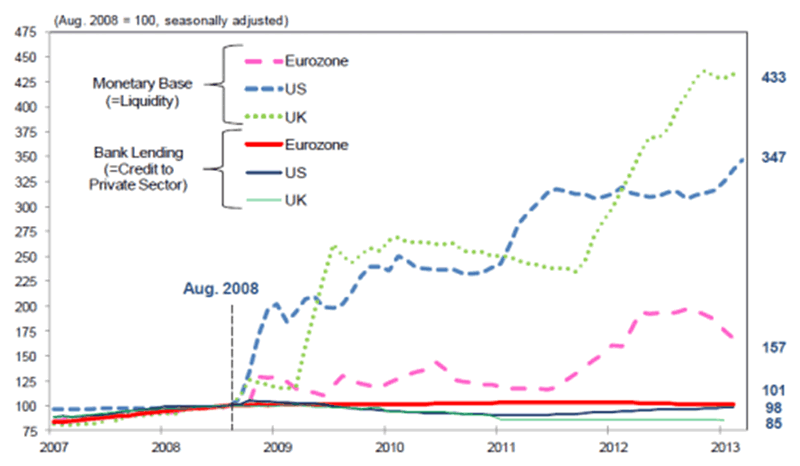
Despite the gigantic monetary injection, it appears that the “newly created money” is not going where it should flow. The following slide shows that liquidity is definitely not going into the private sector. As you can see the monetary base spiked tremendously since the outbreak of our current crisis. Only in Europe it is visible that since last year the monetary base is contracting on a relatively high level.

monetary base vs bank lending

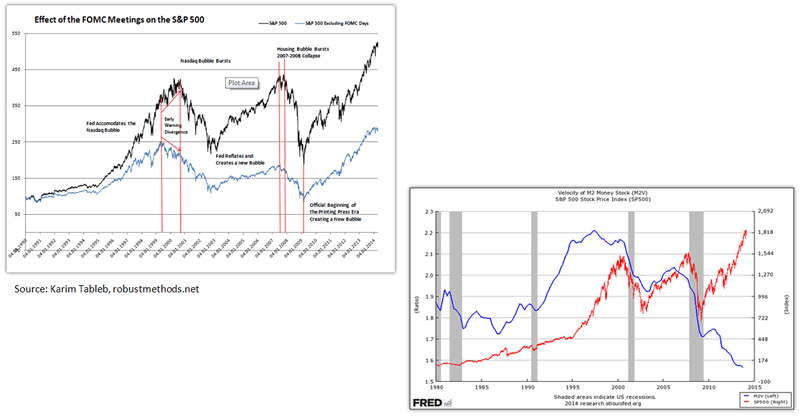
The picture becomes worse when takes into account the interventions of central planners in the markets. In a recent Federal Reserve study it was acknowledged that the historic correlation between the balance sheet of the FED and the S&P 500 prior to the beginning of QE1 stood at 20%. Since 2009, this correlation has increased to 86%. The FED study argued that without the intervention by the central bank, the S&P 500 would be 50% lower. The chart on the left shows how our markets are rigged by the FED! If you exclude the days prior, during and after the FOMC meetings of the FED you see that the performance of the S&P would be considerably lower: 440% vs 170% without FOMC. The chart on the right shows that the velocity of money is sinking so we are not yet seeing any considerable inflation. However it is visible that money is flowing into financial assets, such as stocks, and is creating inflation there.

Central bank interventions on the stock market and velocity of money

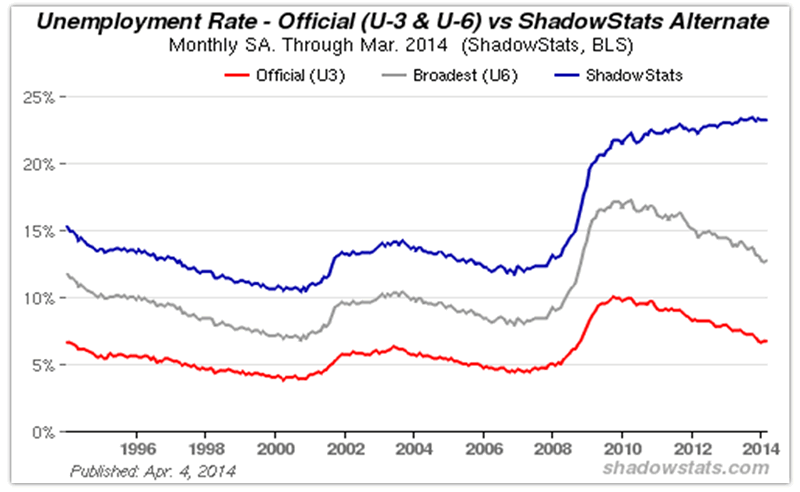
Then there is the manipulation of economic and financial statistics to hide the true state of things. The unemployment figures are one of the striking cases. In the US, the U-3 unemployment rate is the monthly headline number. The U-6 unemployment rate is the Bureau of Labor Statistics’ (BLS) broadest unemployment measure, including short-term discouraged and other marginally-attached workers as well as those forced to work part-time because they cannot find full-time employment. Shadow Stats calculated the unemployment rate using the old US methodology, these figures are nearly 4 times higher than the U3 figures. Data manipulation anyone? With an unemployment rate of nearly 25% I think it is clear that we are far from any form of recovery.

the unemployment rate and manipulation of statistics

The truth of the matter is that central bank intervention and manipulation is only “kicking the proverbial can down the road.” In reality, the stimulus is not producing real growth….”

Full article

Comments »

Investor Sentiment Among the 1% is Becoming Squeamish

“The bull market of the last five years has resulted in extraordinary gains for the wealthy, but some in the 1% aren’t sure how much longer the good times can roll.

A comprehensive study of wealthy families by private bank U.S. Trust found that only 40% of high net worth investors feel “bullishly optimistic” about the market. At the same time, 10% said they felt downright pessimistic and 12% described themselves as fearful of losing money.

im Quinlan, Chief Market Strategist for U.S. Trust, says a lot of rich people continue to worry about regulation, Washington gridlock, and the lingering effects of the Federal Reserve’s unprecedented stimulus program, which has propped up stocks and the housing market but hasn’t done much for the rest of the economy.

Related: America’s middle class: Poorer than you think

“There’s a lot of things keeping them from jumping in with both feet,” Quinlan claims. He says many investors are more focused on the headlines, as opposed to the true earnings potential of American companies.

At the same time, Quinlan is encouraged by the statistics. He thinks they show that stocks still have room to run once more wealthy investors finally do get back into the market.

In that regard, 42% of those surveyed are pursuing higher returns despite the increased risk they see in the stock market. That’s up from just 30% who said the same thing in 2012. Many in the upper class are focused on the long game, with an overwhelming number saying that funding future financial needs takes precedence over short-term financial needs.

But Quinlan says the rich may also be playing catch-up after sitting on the sidelines for the last few years. The study revealed that wealthy investors who currently hold more than 10% of their portfolio in cash were three times as likely to say they missed out on the market rally.

“These investors have been whipsawed. Five years ago their big nest egg was shrinking dramatically,” he says. “Some of these folks may have been lagging behind, now they’re coming back.”

That puts the ultra-wealthy in a similar category to the rest. Many individual investors sat on the sidelines as the stock market experienced tremendous gains…..”

Full article

Comments »

Options and Arbitrage Funds Become the New Hedge for Investors

“Investors are seeking new defenses against possible falls in European stocks as indexes plateau near multi-year highs and traditional hedges prove ineffective in a market anesthetized by near-zero interest rates.

These alternative tools range from option strategies aimed at minimizing the cost of holding a hedge to investing in funds which aim to generate some returns irrespective of the stock market’s direction, such as arbitrage hedge funds.

A 50 percent rally in European shares over the past two years has left investors fretting about high valuations and seeking to protect their gains against a possible selloff.

However, hedging tactics which worked during the jittery days of 2008 and 2011, such as straight bets on rising volatility, have proved inadequate in the current, becalmed market conditions, leading fund managers to look for alternatives.

“A direct exposure to volatility may hurt investors because volatility can still fall or stay at a low level for a long period of time,” said Bruno Pannetier, chief investment officer of London-based hedge fund Old Park Capital. “Investors have to find new ways of hedging.”

Hedging equity positions via futures on the Euro STOXX Volatility index, which gauges the prices of options on eurozone blue-chips and tends to move inversely to cash equities, has cost investors dearly over the past two years.

Firstly, the VSTOXX has fallen roughly 65 percent since the Federal Reserve and the European Central Bank made plain in 2012 that they were prepared to pursue radical measures. The index has shown no sign of revival because the magnitude of swings in the Euro STOXX 50 index has been even lower than option prices imply.

Furthermore, since futures with longer-dated maturities tend to be more expensive than shorter-dated ones at times of low volatility, investors would often have to stump up when selling an expiring contract to buy a new one.

To reduce this cost…..”

Full article

Comments »

The Mortgage Bankers Association Lowers Expectations on New Home Sales

“The two-year-old U.S. housing recovery is faltering.

The Mortgage Bankers Association lowered its new and existing home sales forecast for 2014 to 5.28 million — a decrease of 4.1 percent that would be the first annual drop in four years. The industry group also cut its prediction on mortgage lending volume for purchases to $751 billion, an 8.7 percent decline and the first retreat in three years.

Bullish forecasts in early 2014 from MBA, Fannie Mae and Freddie Mac have been sideswiped by rising home prices and an economy that isn’t producing higher paying jobs.

The share of Americans who said they planned to buy a home in the next six months plunged to 4.9 percent last month from 7.4 percent at the end of 2013, the highest in records going back to 1964, according to the Conference Board, a research firm in New York.

“The big housing rally wiped itself out because prices increased too quickly for buyers to keep up,” said Richard Hastings, a consumer strategist at Global Hunter Securities LLC in Charlotte, North Carolina, who predicted the slowdown eight months ago. “The pool of eligible new buyers is collapsing” because of stagnant incomes and lack of credit, he said.

The best-qualified homebuyers jumped into the market last year to grab near-record low mortgage rates that averaged about 3.5 percent after delaying their moving plans during the housing slump, said Nariman Behravesh, chief economist of IHS Inc., a research firm based in Englewood, Colorado.

Stagnant Wages

The median price of an existing home gained 11.5 percent last year, second only to 2005’s 12 percent increase, the highest on record, according to the National Association of Realtors. This year, price appreciation probably will slow to 5.6 percent, NAR said.

As prices climb, the ability of Americans with stagnant wages to buy homes wanes.

The median U.S. household income rose less than 1 percent in 2013, according to data from Sentier Research LLC in Annapolis, Maryland. In April, the median income was $52,959. When adjusted for inflation, that’s almost 6 percent lower than in June 2009, which marked the beginning of the economic recovery, said Gordon Green, a Sentier partner who formerly directed the Census Bureau office that compiles wage statistics.

“Even though we’re technically in a recovery, household income is lower now than it was in the recession,” Green said. “It makes it a lot harder to buy a house.”

Changing Forecasts

Three major housing forecasters — MBA and government-run mortgage financiers Freddie Mac and Fannie Mae — began the year projecting an average home-sale gain of 10 percent in 2014.

In May, after monthly reductions in their estimates, Fannie Mae and MBA for the first time projected an annual decline, amounting to less than one percent.

Freddie Mac this week lowered its home sales 2014 forecast 1.8 percent to 5.4 million — which would be the first annual drop in four years. The company also cut its prediction on mortgage lending volume for purchases 1 percent to $751 billion, the first annual reduction in three years.

While home purchase applications have picked up recently…..”

Full article

Comments »