iBankCoin
Home / Commodities (page 7)

Commodities

A Long Term Investment for the Newborns: Natty Gas Boom Set to Grow for Three Decades

“U.S. natural-gas production will accelerate over the next three decades, new research indicates, providing the strongest evidence yet that the energy boom remaking America will last for a generation.

The most exhaustive study to date of a key natural-gas field in Texas, combined with related research under way elsewhere, shows that U.S. shale-rock formations will provide a growing source of moderately priced natural gas through 2040, and decline only slowly after that. A report on the Texas field, to be released Thursday, was reviewed by The Wall Street Journal.

The research provides substantial evidence that there are large quantities of gas available that can be drilled profitably at a market price of $4 per million British thermal units, a relatively small increase from the current price of about $3.43.

The study, funded by the nonpartisan Alfred P. Sloan Foundation and performed by the University of Texas, examined 15,000 wells drilled in the Barnett Shale formation in northern Texas, mostly over the past decade. It is among the first to study the geology and economics of shale drilling, a relatively recent development made possible by hydraulic fracturing, or fracking, in which a mixture of water, sand and chemicals is pumped at high pressure into rocks to release gas.

Looking at data from actual wells rather than relying on estimates and extrapolations, the study broadly confirms conclusions by the energy industry and the U.S. government, which in December forecast rising gas production….”

Full article

Comments »

Black Gold Trades Flat, Iran Tensions Ease

“West Texas Intermediate was poised for its first monthly decline since October. U.S. crude stockpiles rose less than forecast, and fuel demand increased in the world’s biggest oil consumer.

Futures dropped as much as 0.4 percent, and have lost 5.2 percent this month, the first February since 2006 that WTI has fallen. Crude supplies climbed 1.1 million barrels last week, data from the Energy Department showed, more than the 2.5 million increase forecast in a Bloomberg survey. U.S. fuel consumption averaged 18.5 million barrels a day over the past four weeks, up 2 percent from 2012, according to the report.

“The EIA delivered a mixed set of U.S. fuel inventory numbers,” said Andrey Kryuchenkov, an analyst at VTB Capital in London who predicts that WTI will trade from $90 to $94.70 a barrel next month. “We are in the refinery maintenance season, when demand slackens.”

WTI for April delivery was down 11 cents at $92.65 a barrel in electronic trading on the New YorkMercantile Exchange at 12:47 a.m. in London. The volume of all futures traded was 29 percent below the 100-day average.

Brent for April settlement on the London-based ICE Futures Europe exchange advanced 35 cents to $112.22 a barrel. Volumes were about 45 percent of the 100-day average. The European benchmark grade was at a premium of $19.57 to WTI futures, compared with $19.11 yesterday.

Fuel Supplies…”

Full article

Comments »

WTI & Brent Trade Flat as Iran Talks are Dubbed as a Turning Point

“West Texas Intermediate rose from its lowest level this year. World powers and Iran ended two days of talks without agreement on the country’s nuclear program.

Futures gained as much as 0.5 percent. Iranian nuclear negotiator Saeed Jalili said negotiations with the U.S. and its partners will resume next month in Istanbul after discussions in Almaty, Kazakhstan, concluded. Americans and others made no offer to ease oil or financial sanctions on Iran, said a U.S. official, asking not to be identified. Crude inventories climbed by 904,000 barrels last week to 373.4 million, the highest level since December, the American Petroleum Institute said yesterday.

“Although there are promises for another round of talks and statements on both sides seem to be putting a positive spin to the talks, there was no deal done,” said Amrita Sen, chief oil market strategist at consultant Energy Aspects Ltd. in London.

WTI for April delivery was at $92.84, up 21 cents, as of 12:05 p.m. London time in electronic trading on the New York Mercantile Exchange. The volume of all futures traded was 23 percent below the 100-day average. The contract slid 48 cents, or 0.5 percent, to $92.63 yesterday, the lowest close since Dec. 31. Prices have gained 1.1 percent this year and declined 4.7 percent this month.

Brent for April settlement on the London-based ICE Futures Europe exchange was up 36 cents at $113.07 a barrel. The volume of all futures traded was in line with the 100-day average for this time. The European benchmark crude was at a premium of $20.23 to WTI futures, compared with $20.08 yesterday….”

Full article

Comments »

In Depth Gold and Silver Analysis

“Developing market activity is the best and most reliable source for market information. All you have to do is follow what the activity is saying, and you will have the clearest idea of where the market is headed. For the near term, of heightened concern for many, the market says the current decline is far from over. Price may not be far from the low of the decline, but the trend is down, and it takes time to turn a trend around, so do not expect to see a dramatic rise in the price of either gold or silver.

Our downside target of $1600 gold has been exceeded, while the $28 target for silver has not been met, although in horseshoes, it would be a leaner. [See Decline Not Over, 1st and 3rd charts, click on http://bit.ly/WWXFlt]. Next week, who knows?

The biggest advantage in letting the market speak loudest is that all one need do is follow its path, for it always leads to a logical conclusion. The conclusion may not fit with one’s hopes or expectations, many times, but the market never misleads in its intent. It is not always easy to read, occasionally, so during those times, it is best to do nothing until a clearer direction becomes more discernible.

This week, the silver charts lead because we see them as more telling than gold. The monthly is our starting point. It will become apparent why silver warrants more focus when compared to gold as you view the respective charts.

We continue to mention the bullish spacing because it puts the metals into an important context from a larger perspective, and the spacing lets us know that silver and gold remain in uptrends with gold net stronger, but just not for the near term. A look at the monthly gold chart will make that perfectly clear.

This does not mean gold/silver will not still go lower. For now, developing market activity continues to point in that direction. Prices may be at or near a low, but we see no ending action that says one has been reached.

There is a very positive development in silver, even after last week’s sharp decline. An important change in behavior occurred in August 2012 when silver rallied out of the doldrums for two strong months, “2” on the chart. What is somewhat impressive about the current decline is how it has been labored relative to the two month rally in mid-2012. After 4+ months, [it says 5* on the charts, the * signifying the 5th month is not over, and no one knows where it will end], that breakout area is still holding.

Compare the two strong rally bars with the 5 overlapping decline bars. They tells us sellers are expending a lot more effort to drive price down to the starting level where buyers took over last August.

It could be that February will continue to fall and go under the 26 level, we do not know. All we can do is look at what is known, to date, and draw some conclusions. Seeing more detail in the weekly and daily charts may help.

When you compare the weekly gold chart to silver, you will see how gold is weaker for the near term. We do not follow any fundamentals, but it could well be that the underlying supply/demand factors for silver, with its industrial use, are far more important than viewing silver as a poor man’s gold substitute as a store of wealth. Similar usage demands do not exist for gold.

Price remains in a down channel, just it is slightly under, and it is also near the breakout level from August 2012, both concurrently offering potential support in this negative market.

An explanation is provided in the left corner of the chart concerning the dashed portion of the lines. They extend from 3 and 2, respectively, at the point in time just after swing high 3 is known. How price reacts to these lines provides important market information.

In the previous article, Decline Not Over, http://bit.ly/WWXFlt, also on the third chart we commented how price failed to reach the upper channel line, see arrows below, and maybe head back toward $28? This is how one pays attention to the market’s message in order to avoid surprises or be on the wrong side.

One reason why we say silver may be at/near a low point is the climatic volume, three days ago, which also drove price under the lower channel oversold line. Markets often end in excess, and sharply higher volume always warrants attention for it almost always entails a transfer of risk from weak into strong hands. Smart money buys bottoms, and they show their hand by increased volume.

The volume from last Wednesday is mostly all short-covering. Net new buying usually comes in after a bottom is confirmed, and that is a caveat for acknowledging that price can still go lower, maybe not by much, but sill lower, to whatever degree. There has been no indication of confirmed ending action, yet.

The last two trading days have much smaller ranges and overlapping bars. The market is telling us there was zero downside follow-through after Wednesday, and overlapping bars reflect a balance between buyers and sellers at a point where sellers have been in total control. These are littler messages, and they need confirmation before acting on them.

It is interesting to note…”

Full article

Comments »

Gazoline Prices Still on the March, Prices May Finally Be Slowing Pace to the Upside

“The average price for regular gasoline at U.S. pumps rose 20.32 cents a gallon in the past two weeks to $3.795 a gallon, according to Lundberg Survey Inc.

The survey covers the period ended Friday and is based on information obtained at about 2,500 stations by the Camarillo, California-based company. The average has jumped 53.71 cents this year and is 10.33 cents above a year earlier.

“Although this is a steep rise, it’s not as steep as the price rise during the prior two weeks,” Trilby Lundberg, president of Lundberg Survey, said in a telephone interview. “There’s reason to expect the price rise will not continue at this pace and may even end soon because crude oil prices are down and refiners are starting to cut wholesale prices to their marketing and retail customers.” …”

Read more

Comments »

Hedge Funds Cut Gold Bets The Most Since 2007

Hedge funds cut bets on a rally in gold by the most since 2007 and became the most bearish ever on sugar and coffee as concern that the Federal Reserve will slow U.S. stimulus programs drove prices for raw materials to the biggest loss this year.

Money managers and other large speculators reduced their net-long position in gold futures and options by 40 percent in the week ended Feb. 19 to 42,318, the biggest drop since July 31, 2007, U.S. Commodity Futures Trading Commission data show. Wagers across 18 U.S. raw materials tumbled to the lowest since December 2011 as investors’ net-short positions for sugar and coffee hit record highs. Bullish corn wagers fell the most since June 2010….”

Full article

Comments »

Obama Administration Moves Forward on Climate Change Without Congress

“President Barack Obama is tired of waiting for Congress to move on legislation to reduce carbon emissions, and his administration is poised to move forward on actions to do just that—including a move that will effectively eliminate the possibility of any new coal plant opening in the United States, experts say.

“We can choose to believe that Superstorm Sandy, and the most severe drought in decades, and the worst wildfires some states have ever seen were all just a freak coincidence,” Obama said during his State of the Union address. “Or we can choose to believe in the overwhelming judgment of science—and act before it’s too late.”

Climate change has been a controversial public policy issue in recent years, as many conservative Republicans have denied a relationship between carbon emissions and incremental increases in temperatures, which many scientists link to increasingly severe weather events.

Democrats, on the other hand, have used the evidence to push for regulations limiting carbon emissions. In 2009, the Democratically controlled House of Representatives passed landmark climate-change legislation but the Senate, also controlled by Democrats, declined to take up the measure heading into the 2010 elections.

Now, with Republicans in control of the House, it’s even more unlikely Congress will act on any bill that would accomplish the president’s goals, so the president indicated he’s moving forward on his own….”

Full article

Comments »

Is Silver Finally Cheap ?

I could not resist and picked some up yesterday.

“After a nearly 9% dive in silver prices this month, investors should be able to breathe a sigh of relief as growth in industrial and investment demand gains pace, and calls of “oversold” conditions and “bargain” prices for the precious metal intensify.

“Silver is grossly oversold at current levels, more so than any time in the past five years,” said James Carrillo, senior portfolio adviser for precious-metals investment firm Swiss America Trading Corp.

Silver futures prices SIH3 -0.92% have lost $2.65 an ounce, or 8.5%, this month, after closing at $28.70 Thursday on the Comex division of the New York Mercantile Exchange. Year to date, they’ve lost over 5%. That compares with gold’s GCJ3 -0.35%month-to-date loss of around 5% and a nearly 6% decline for the year.

“Fundamentally, silver should be rising,” as physical demand remains strong, said Carrillo. “However, the technical side of the market is dictating direction currently.”

Before Thursday’s 0.3% gain, silver prices had fallen for five sessions in a row—dropping nearly 8% during that losing streak and breaking a key support level by settling below $30 on Feb. 15. Prices closed Wednesday at their lowest since Aug. 20. The iShares Silver Trust SLV -0.65%  , which holds silver bullion, is down nearly 6% this year.

The absence of China last week due to the Lunar New Year celebrations “set the ball rolling and left the silver price at the mercy of the technical picture,” said Julian Phillips, a South Africa-based contributor to SilverForecaster.com. “I would expect a snapback just as surprising as the fall.”

Good signs….”

Full article

Comments »

WTI Continues its Fall to Extend the Largest Drop in Three Months

“West Texas Intermediate oil dropped for a second day, extending the biggest decline in three months. U.S. crude stockpiles gained for the sixth week in seven, according to the American Petroleum Institute.

March futures fell 2.3 percent when they expired yesterday, the steepest drop since Nov. 20. U.S. crude inventories gained 2.96 million barrels last week to 372 million, the highest level since December, according to API data issued yesterday after futures settled. A government report today may show supplies rose 2 million barrels, according to a Bloomberg survey. TheFederal Reserve signaled it may consider slowing the pace of asset purchases, according to minutes of the Jan. 29-30 meeting.

“The much-needed correction has taken some steam off the overbought market,” said Andrey Kryuchenkov, a commodities analyst at VTB Capital in London, who forecast last week that oil prices would drop. “Short-term fundamentals simply do not justify sustained gains.”

WTI for April delivery slid as much as $1.67 to $93.55 a barrel in electronic trading on the New York Mercantile Exchange, the lowest since Jan. 16, and was at $93.87 at 11 a.m. London time. The March contract fell to $94.46 yesterday. The volume of all futures traded is 108 percent above the 100-day average.

Brent for April settlement tumbled as much as $1.48 to $114.12 a barrel on the London-based ICE Futures Europe exchange. Volume was more than 80 percent more than the 100-day average. The European benchmark grade was at a premium of $20.50 to WTI futures, compared with $20.38 yesterday. The gap expanded to $23.18 on Feb. 8, the widest since Nov. 26.

Fuel Stockpiles

Oil is extending losses in New York after breaching technical support yesterday, according to data compiled by Bloomberg. Futures settled below $95 a barrel, the trough between a “double-top” that formed after advances stalled near $98 on Jan. 31 and Feb. 13. The price gap is about $3, signaling crude may fall to around $92 in a so-called reversal. Losses tend to accelerate when chart support fails.

U.S. gasoline stockpiles slid by 122,000 barrels last week to 232.6 million barrels, API data show. The Energy Department is projected to show separately a decline of 900,000 barrels, according to the median estimate of 11 analysts in a Bloomberg News survey before its report is released today.

Crude supplies at Cushing, Oklahoma, the delivery point for futures traded on the New York Mercantile Exchange, increased 546,000 barrels to 50.8 million, according to the API….”

Full article

Comments »

Gold Gets Hit Again as Outlook for Growth Strengthens

“Gold futures slid to a six-month low in the worst losing streak in more than a year as signs of economic improvement curbed demand for a protection of wealth. Silver fell to the lowest since August and platinum dropped.

Gold declined for a fifth session as global equities reached the highest since June 2008. The Federal Reserve will publish minutes of its Jan. 29-30 policy meeting today and Labor Department data on producer prices today and on consumer costs tomorrow will show inflation is in check, economists surveyed by Bloomberg said.

“Bullion’s safe-haven properties as well as its traditional use in inflation hedges are irrelevant at this point,” Andrey Kryuchenkov, an analyst at VTB Capital in London, wrote in a report. “The market’s attention is set to turn to the Federal Open Market Committee’s January minutes.”

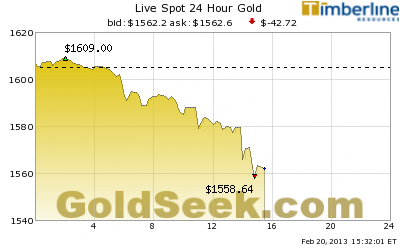
Gold futures for April delivery fell as much as 1 percent to $1,588 an ounce, the lowest since Aug. 2, and were at $1,592.60 by 7:50 a.m. on the Comex in New York. A fifth straight drop would be the longest run since December 2011. U.S. markets were shut Feb. 18 for the Presidents’ Day holiday.

Futures trading volume was 53 percent above the average in the past 100 days for this time of day. Gold for immediate delivery was down 0.7 percent at $1,593.30 in London….”

Full article

Comments »

Analyst are Still Perplexed by $5 Gasoline

“As gasoline prices rise above $5/gallon in LA, analysts are puzzled. Gasoline prices have been on the rise for the past 31 days, which is highly unusual for this time of the year. Typically prices begin rising in March or April as the driving season kicks off.

The price increases are particularly puzzling, given the fact that US gasoline markets have been well supplied relative to historical levels (see figure 1).

Certainly the recent increases in crude oil prices have been a large part of the explanation. Some have suggested that increased demand due to stronger global economic activity is to blame. Other reasons have been proposed as well.

CNN: – What’s behind the higher prices at the pump? It’s a confluence of factors, from rising crude oil prices, to production cuts and refinery closings.

“Right now, things are tight worldwide,” said Ray Carbone, president of New York commodities trading firm Paramount Options. “Refineries going down, unanticipated maintenance, and higher demand … going into driving season.

Gasoline futures trading on NYMEX (CME) have been rising almost daily, pointing to even higher prices at the pump in the spring (see figure 2)….”

Full article and charts 

Comments »

WTI and Brent Trade Sideways After Paring Losses


“West Texas Intermediate fell, extending the biggest drop in two weeks, while Brent was little changed. The North Sea crude may be capped at $140 a barrel this year, according to Bank of America Merrill Lynch.

Futures lost as much as 0.6 percent, after sliding 1.5 percent Feb. 15, the most since Feb. 4. Floor trading in New York was closed yesterday because of a holiday in the U.S. Brent will trade in a range of $100 to $130 a barrel through to 2015, according to Francisco Blanch, head of commodities research at Bank of America Merrill Lynch. A technical indicator signaled price declines may accelerate.

“The market is trying to decide whether we are just testing support or whether we are facing what many are saying is a long-overdue correction,” Ole Hansen, the head of commodity strategy at Saxo Bank A/S in Copenhagen, said today in a telephone interview.

WTI for March delivery, which expires tomorrow, slid as much as 61 cents to $95.25 a barrel in electronic trading on the New York Mercantile Exchange and was at $95.40 at 4:04 p.m. Dubai time. The more-active April contract dropped 54 cents to $95.87. Yesterday’s transactions will be booked with today’s trades for settlement.

Brent Premium…”

Full article

Comments »

Gold Rises After a Week of Drudging on Speculation the Lows are In

“Gold gained for the first time in a week in London on speculation that prices near a six-month low will increase purchases.

Gold is down 3.7 percent this year and global equities are up 4.8 percent as speculation grew that economies are improving. About $1.2 trillion in automatic spending cuts stemming from a 2011 agreement are scheduled to take effect in the U.S. in March. Morgan Stanley said in a report yesterday it expects “bargain hunting” in gold this week.

“It’s very cheap,” said David Lennox, a resource analyst at Fat Prophets in Sydney, referring to gold. “The U.S. has still got to deal with budgetary and debt constraints, they’re not going to go away. While that’s still there, we think there’s opportunity for gold to rally robustly.”

Gold for immediate delivery added 0.2 percent to $1,612.90 an ounce by 11:26 a.m. in London. Prices reached $1,598.23 on Feb. 15, the lowest since Aug. 15. Futures for April delivery were 0.2 percent higher at $1,612.60 on the Comex in New York.

U.S. markets were shut yesterday for the Presidents’ Day holiday. Futures trading volume was almost triple the average in the past 100 days for this time of day. Bullion at the morning “fixing,” used by some mining companies to sell output, was at $1,613.50 in London, up from $1,610.75 yesterday afternoon.

Silver for immediate delivery rose 0.5 percent to $30.045 an ounce. It reached a six-week low of $29.6912 on Feb. 15. Palladium gained 0.6 percent to $766.83 an ounce. Platinum was up 0.1 percent at $1,694.97 an ounce….”

Comments »

The Gold Cold War is Upon Us

“The collapse of the USSR in 1991 was seen as the triumph of capitalism over communism. The 40-year cold war was over and the West had won. That perception, however, was as premature as it was misleading. The struggle of world powers wasn’t over. Today, the struggle continues in a far more fundamental venue; on capitalism’s home court in the arena of paper money.

The West, as Mao Tse-Tung once claimed, is not a paper tiger; unless, of course, you’re referring to its paper money. 

In 1991, communism was, in fact, collapsing. But capitalism, unbeknownst to itself and others, was bankrupt after its costly decades-long struggle with communism. Today, the former communist super-powers, Russia and China, have re-emerged and are playing the high-hand of gold against England, the US and the West and their now vulnerable paper currencies.

England’s debt-based paper banknotes were the reason for the West’s three hundred year global hegemony. Because of its ability to wage war on credit and pass off its debt-based paper banknotes as money, England in the 18th and 19th centuries and, later, the US in the 20th achieved a level of world power not seen since the Roman Empire.

In the 1900s, Russia and China escaped the West’s capitalist dominion by adopting communism, an alternate economic paradigm, based on the theories of Karl Marx, Friedrich Engels and Vladimir Lenin. Communism was, in fact, a potent and dysfunctional amalgam of untested theories, unfounded hopes and totalitarian state oppression.

Ostensibly offering a more equitable distribution of wealth than the banker’s paradigm of credit and debt, Marxism/Leninism was, in fact, a bloody and costly trap into which Russia and China would both fall in their attempts to escape the West’s economic and political domination.

The West’s attempts to subjugate Russia and China would, however, ultimately cost the West its foundation of economic and political power, i.e. the ability to pass off debt-based paper banknotes as money.

In capitalist economies, debt-based paper money possessed intrinsic value because it was convertible to gold upon demand. Gold, in fact, was capitalism’s ‘secret sauce’, the essential ingredient that transformed the bankers’ debt-based banknotes into something other than government-issued IOUs.

Since 1971, however, the West’s paper banknotes are no longer convertible to gold. This is because after WWII, the US, in its attempts to militarily subjugate Russia and China overspent its massive gold reserves, forcing it to end the gold-convertibility of the US dollar. As a result, all currencies in the world formerly tied to the US dollar and hence to gold became fiat, i.e. currencies who have value only because of government fiat, i.e. command.

After 1971, it was only a matter of time until the bankers’ debt-based paper banknotes—without the convertibility to gold—would become increasingly unstable and ultimately worthless; and, today, in 2013, the former has happened and the latter is underway.

The value of today’s paper money is determined solely by currency speculators placing leveraged bets in the hopes of achieving short-term gains. Once the gold-convertibility of paper money ended, modern currencies became paper coupons with expiration dates written in invisible ink.

Today, the West and its bankers are desperately hoping that no one will notice, hoping thereby to prevent a hyperinflationary collapse of paper money should confidence in fiat paper money evaporate.

Russia and China, however, are preparing for that very day. Russia and China are stockpiling gold as fast as they can in anticipation of a coming currency crisis triggered by the West’s increasingly suspect paper money.

For the former communist powers, Russia and China, it’s payback time; but for England and the US, it’s blowback time

Blowback, an unforeseen and unwanted effect, result, or set of repercussions

    Merriam-Webster dictionary

THE EAST IS GOLD WITH A RED TINGE

On February 6, 2013, in China Gold Imports from Hong Kong Climb to record on Wealth, Bloomberg New reported:

Exports of gold to Hong Kong from China more than tripled to 310,861 kilograms in 2012 from about 95,529 kilograms a year earlier, according to Bloomberg calculations. Shipments were 29,718 kilograms in December, up from 28,978 kilograms in November.

In the article, Bloomberg News also noted the growing relationship between China’s wealth and the ownership of gold:

China’s urban per capita disposable income rose 12.6 percent in nominal terms in 2012 to 24,565 yuan, the National Bureau of Statistics said on Jan. 18. Per capital rural net income increased 13.5 percent in nominal terms, and 10.7 percent in real terms…

Not only is China buying record amounts of gold, Russia is buying even more. On February 11th  in Putin Turns Black Gold Into Bullion as Russia Outbuys World, Bloomberg News reported that Russia’s President Putin is investing Russian’s oil income in gold bullion at a record rate:…”

Full article

Comments »

Clash of the titans: Soros and Pimco Go Bearish on Gold While John Paulson Stands Strong

“Prominent hedge fund manager John Paulson continued to hold significant gold investments in the fourth quarter of 2012, even as other investors pulled out.

Notable institutional investors, including George Soros, Julian Robertson and Allianz’s Pimco reduced their bets on gold during the quarter, when bullion posted its biggest quarterly loss in more than four years.

Paulson & Co owned 21.8 million shares in the world’s largest gold-backed exchange-traded fund, SPDR Gold Trust, at the end of December, unchanged from Sept. 30, a filing with the U.S. Securities & Exchange Commission showed on Thursday.

“That’s a good sign as he’s a big player. It shows that he still has long-term faith in the market,” said Bill O’Neill, a partner in commodities investment firm LOGIC Advisors.

Paulson is by far the biggest shareholder of the SPDR gold ETF. He has often advocated gold to offset risks related to currency exposure and U.S. dollar depreciation.

The value of Paulson’s SPDR ETF holdings, however, dropped to $3.54 billion in the fourth quarter from $3.75 billion in the third, resulting in a paper loss of $215.5 million for his fund.

The decline was because of a 5 percent, or $100, drop in the price of spot gold during the fourth quarter.

Some analysts cited year-end hedge fund redemption for gold’s pullback in the quarter….”

Read more

Comments »