[youtube://http://www.youtube.com/watch?v=3P0kGvvgd3k 450 300]
Comments »Monthly Archives: July 2014
Using Excel to Spot Market Trends
Watch the Greenback Closely, Breakout or Breakdown is Coming Soon
“A few notes first off…the US Dollar Index has broken below 80.0, but for this to mean anything, the US Dollar must close below 79.40 on a weekly basis. The critical levels of upper support and resistance are so tight right now, that the volatility we have seen has caused many players to go long when its wrong and go short when they should abort. The trend finally does “appear” as if the 79.40 level will break, but nothing is better than waiting for confirmation than speculation.
If the US Dollar Index does go lower, then this would allow US exports to become cheaper and further enhance the stock market. The note below is very important, so please consider this: a decline in the US Dollar Index from 80.0 to 73.0 represents a loss of 8.75%. If the S&P were to retain its S&P/US Dollar Index valuation, then it would have to rise from 1960 to 2148. So even though the S&P could rise to this level, which remains our longer-term target into August 2015 next year (Please Google Contacting Fibonacci Spiral (CFS) and CFS chiral inversion with my name to get an understanding of this longer-term stock market cycle and its implications for how things unfold into 2020), it merely becomes an extension based upon a declining currency. If the US economy strengthens, then this number could become even higher.
The outcome for such an event if it does unfold as expected (things have been going as expected, just a few bumps in the road have happened) will result in many other regions of the globe experiencing sharp reductions in global GDP and rising energy prices (since oil is primarily priced in US Dollars). Rising energy costs are instrumental in throwing the global economy into a deflationary spiral, coupled to demographics so a sharp spike in energy prices to $150-160/barrel (our target for next year) is seen as the catalyst. Based upon the chiral inversion that the CFS had last year, it is expected the market tops out next year, followed by a series of lower lows in 2016, 2018, 2019 and 2020 (3,2,1,1 to complete the Fibonacci spiral). This would be expected for the broad stock market indices of the US and not necessarily expected for commodities or their related stocks, particularly gold and silver.
A shift into gold and silver as a store of value will happen en masse once people see that governments will do whatever they can to try to steal the wealth of citizens. This will raise their sought value, alongside stocks that mine gold and silver.
The very last few charts of this update provides an update of the Elliott Wave count for the S&P 500 Index. I did not understand how this count was possible because I really doubted it. So far, it seems to be holding out and does have some interesting twists over the next 10-13 months if things continue to unfold in somewhat of an expected fashion, then the period of time between 2015 and 2020 will not be nice.
If we do get a 5 year period of cycling deflation/inflation, with the overall trend being deflationary, then keeping money in cash equivalent funds will be of utmost importance for preserving wealth. For those who can time things right, buying near the coming bottoms and selling near their short-term tops stand to generate significant returns. For those that have pension funds or RRSP’s LIRA’s etc. that are are defined contribution plans (i.e. YOUR money, not money thrown into corporate or unionized pots that are invested for everyone (think pyramid scheme)) the above may work well. In the end, those with defined contribution plans for their own pensions may see government take them over and put them into a pot…this is out of everyone’s control, but one can only do the best to preserve what they have.
Continue to pay down debt and minimally invest money into RRSP’s or LIRA’s as this could be taken over by government. Keep money in on hand investments and of course, continue to accumulate gold and silver bullion. This piece should keep everyone afloat with knowledge for what to expect over the coming 12-14 months out.
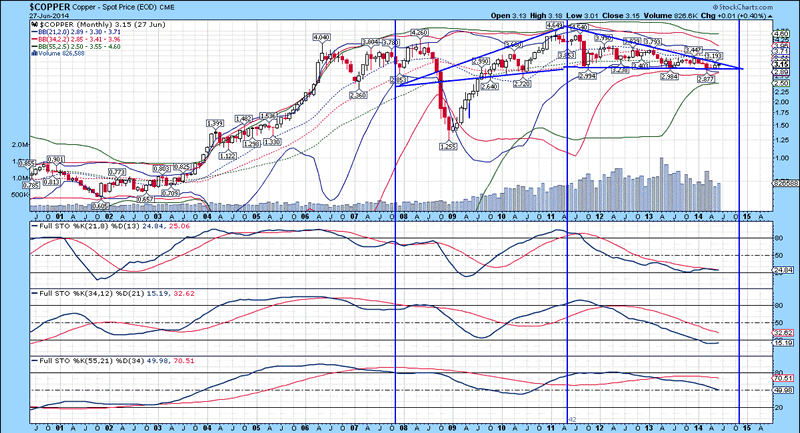
Copper Chart
I thought I would include the monthly chart of copper, because today it broke out of this very long diametric triangle structure, that has a measured move up to $4.80/pound if this analysis is correct. Bollinger bands are not providing any indication of trend, but a pop above the upper trend line (which is what has happened today) should provide further bullishness in this metal. Nickel and other base metals are rising, so copper is one of the most critical to confirm this trend. Full stochastics 1, 2 and 3 are shown below in order of descent, with the %K beneath the %D in all three instances. Extrapolation of the %K trend in stochastic 1 has yet to rise above the %D, but follow through over the next few months in copper prices would be enough to indicate a change in trend. The latter half of the diametric triangle pattern (not a diametric Elliott Wave triangle) has seen an evermore narrowing of the trading range in price. Given the way everything is expected to occur over the coming year (higher inflation due to a declining US Dollar, which further fans the global economy due to more potential for the US to export goods at cheaper prices), it stands to reason that copper prices head higher. We have one copper stock (producer/explorer) that we follow that trades well below $1/share but has significant opportunity for rising in price, pending it is not bought out beforehand.
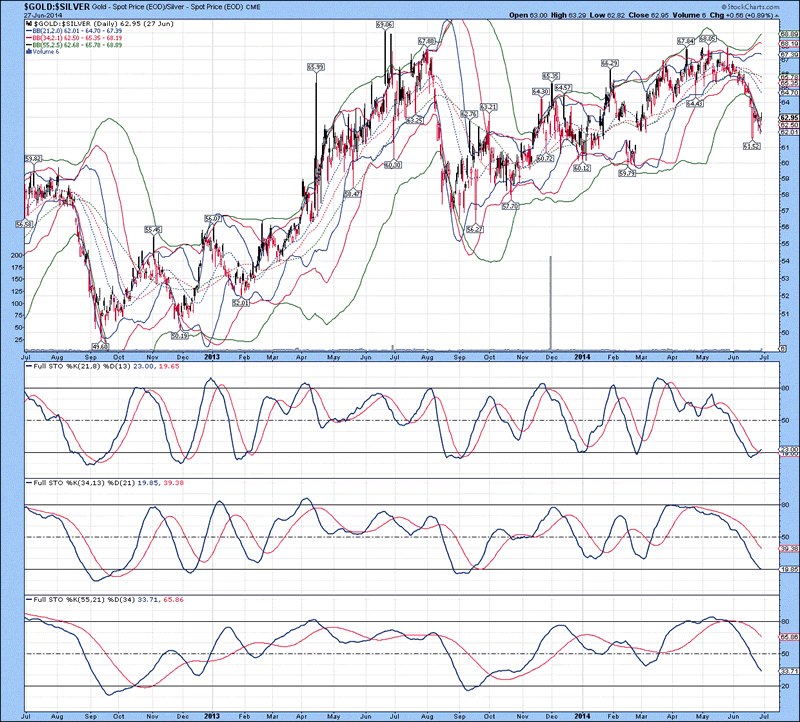
Gold Ratios
The daily chart of the gold/silver ratio is shown below, with several price excursions beyond lower Bollinger bands over the past week strongly suggests an oversold condition has been generated, which should see gold outperform silver over the course of the next few weeks. Full stochastics 1, 2 and 3 are shown below in order of descent, with the %K above the %D in 1 and beneath the %D in 2 and 3. Although there could be a change in trend with respect to the ratio, weakness could remain in effect, with a longer-term trend being down (i.e. Silver would outperform gold under this scenario).
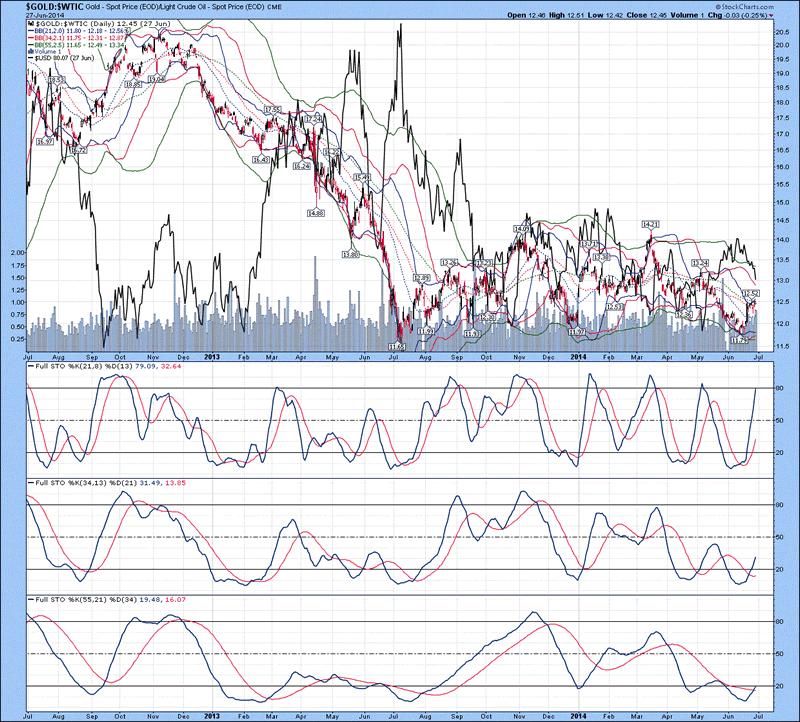
The daily chart of the gold/oil ratio index is shown below, with the US Dollar Index denoted in black. Bollinger bands are providing no indication of trend, while the %K in all three stochastics are above the %D, indicating gold is likely to continue outperforming oil over the next 5-7 weeks (based upon the depth of the %K in stochastic 3). The ratio is likely to only rise no higher than 14 over the short-term, which would represent 12% higher gold prices than current levels, assuming oil remains fixed around $105/barrel…that would work out to $1484/ounce, which is right in line with the expected high for gold over the course of the next 12-14 months. Since gold stocks generally outperform gold by a factor of 3, that would suggest the HUI tacks on around 36% above current levels, which works out to a move to 320. Things finally appear to be pointing towards higher commodity prices, but remember, THIS IS ONLY A TRADE UNTIL AROUND THIS TIME NEXT YEAR, because from late 2015 and into 2020, a severe global contraction will likely result in a bear market across many fronts. Precious metals are likely to rise in value as fewer people trust government and a rush into tangibles happens.
The weekly chart of the HUI/gold ratio is shown below, with gold denoted in black. This is probably the most important chart in the Universe for those who hold precious metal stocks, because it gives an indication of whether or not shares will outperform gold on a relative basis. Bollinger bands are extremely tight as a base has been built over the past 12 months. Based upon this, a move higher is very likely since lower lows did not happen. Full stochastics 1, 2 and 3 are shown below in order of descent, with the %K beneath the %D in 1 and above the %D in 2 and 3. Down trend lines for the %K in stochastics 2 and 3 are included which illustrates the %K in stochastic 3 breaking above its downtrend line. Notice the %K in stochastic 2 was recently repelled by this downtrend line, yet has curled up and appears set to break higher. ….”
Comments »
Low Vol Sparks Massive Carry Trades
“Volatility in the currency market is near a record low, and that has led market participants to bulk up on carry trades, which involve borrowing in a currency with low interest rates to invest in another with high rates of return.
But experts warn that those trades can be quite dangerous if volatility kicks up or interest rates suddenly shift.
The low interest rate environment worldwide has investors scouring the globe for decent returns. “Essentially, ‘carry’ has returned in the pursuit of yield,” Anjun Zhou, head of multi-asset research at Mellon Capital Management, told The Wall Street Journal.
As for the risk of carry trades, “there’s a fear that it’s based on unsustainable market factors, like low interest rates and volatility in both [foreign exchange] and fixed income,” Steven Englander, head of developed-market foreign-exchange strategy at Citigroup, told the paper.
And some experts say it’s too late to place carry trades anyway. “If you haven’t put on the ‘carry’ already, it’s become a harder trade,” Alan Ruskin, head of developed market foreign-exchange strategy at Deutsche Bank, added.
Others agree with Ruskin…..”
Comments »Will Payrolls Have a Breakout Year as Companies Gain Confidence ?
“A family-run concrete business in Michigan, the U.S.’s second-biggest carmaker, the largest railroad and a solar power provider in California are all hiring as industrial companies lead a broad labor-market rebound that’s on pace to add the most jobs in 15 years.
Employment may be headed for a “breakout year” as companies feel more secure adding to payrolls following several years of demand rising only to stumble on threats from U.S. budget standoffs, a debt-ceiling induced default and a European credit crisis, said Marisa Di Natale, a director at Moody’s Analytics.
“It’s the first year in several where we haven’t had some kind of manufactured fiscal showdown inWashington, which weighs on business confidence and consumer confidence,” Di Natale said.
Industries from construction to autos to oil and gas are increasing jobs as growth accelerates after a harsh winter stunted business. As some sectors, such as floor retail sales, have yet to rebound and wages have been kept in check, the recovery is likely to be a steady climb rather than a boom, according to Jeffrey Joerres, executive chairman of Milwaukee-based staffing company Manpowergroup Inc.
Nonfarm payrolls may rise by 215,000 in June, which would mark a fifth straight month of increases topping 200,000, according to the median of 89 economists’ estimates ahead of the Labor Department’s monthly employment report on July 3. That also would be the longest streak of monthly gains since September 1999-January 2000.
Help Wanted
Help-wanted signs at concrete company Kent Cos. is one indication of a hiring rebound that could create more than 2.56 million jobs, the most since 1999, if the pace is sustained. Warren Buffett’s BNSF Railway Co. plans to grow by 2,100 positions in 2014. SolarCity Corp. (SCTY) is adding 400 people a month at the rooftop power-system installer backed by Elon Musk. At Ford Motor Co., hiring is so strong that the automaker predicts it may beat a 2011 plan to bring on 12,000 new workers by 2015.
“We do see and feel and hear from our clients that there is a building of demand,” Manpower’s Joerres said. Many employers that once held off on hiring now can’t wait any longer because “they have stretched everyone for the most part to the maximum.”
Jeff VanderLaan, chief executive officer at Kent Cos., plans to add 100 people this year, a 27 percent jump in his workforce to a record 475. The Grand Rapids, Michigan-based provider of services such as pouring floors and installing piers is seeing business boom in Texas, North Carolina and Ohio.
Economic Growth…”
Have We Reached Peak Leverage ?
“This week has not been sleepy when it comes to the news. It feels like a firecracker out there just waiting for a match in my opinion. There have been too many issues to cover them all but here are a few TedBits for you:
- Surrender
- GDP collapse
- Explosive divergence between volume and price
- MORAL HAZARD written large
- Leverage peak in stocks?
- SOME People aren’t DUMB
- EU elites pull another FAST ONE
Surrender
One hundred years ago this week World War I commenced and the specter of World War III is at our doorstep. Secretary of State John Kerry unilaterally surrendered to ISIS in Iraq by stating unequivocally to regional powers that the conflict will not be solved by military means. The very idea that ISIS will sit down at any table and peacefully resolve any issues is a fairytale. The ISLAMIC Caliphate is on a mission from GOD and will not be dealing with infidels in any manner other than their demise or the threat of their own demise. It is as simple as that. As I have said previously: World War III has commenced, it just hasn’t been publically admitted yet. Kerry’s statements are the height of irresponsibility to the American people.
GDP collapse
Yesterday’s revision to GDP was a nightmare on Main Street both on the headline number and internally looking at its components. Originally called at up 2%, then the first report of up .1%, first revision was down 1% and this revision taking it to down 2.9%. We were told over and over it was the weather. NOPE.
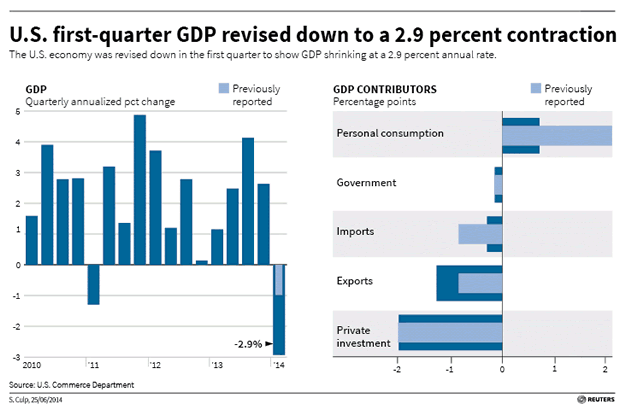
Look closely at the HORROR show the revision has been. It was a collapse in healthcare spending as a result of OBAMACARE (healthcare spending down over 6%), a collapse in private investment, a surge in imports (surge in liabilities) and a collapse in exports (collapse in income and sales). FOUR knock out blows to Keynesian linear thinking and highly questionable projections of a recovering economy. The economy is real terms is not recovering, in nominal terms the piles of debt and leverage keep expanding and then called GROWTH.
This is tens of billions of dollars economic activity that has disappeared. It foreshadows the coming bailout of the health insurance industry as its business is collapsing from the GOVERNMENT MANDATED policy cancellations in 2013 that HAVE NEVER RETURNED. Obamacare is higher priced and delivers much less services. Private sector investment will not return as there is no reward for doing so. Why would a company or individual invest when there is no INCOME GROWTH after real inflation? Incomes and revenues must rise for investment to become attractive. It’s why M&A is on FIRE, it is easy to buy existing business and customers rather than BUILD NEW ONES. Why would an entrepreneur risk his hard earned dollars, blood, sweat and tears to get to a level of success over $250,000 dollars a year when he or she can expect the taxman to confiscate it as soon as he reaches success? Washington has removed the incentives to produce. We are its vassals not its master.
Add to this, Dodd Frank restricting credit to the private sector, mandated health care benefits, EPA attacks on affordable energy and the hoax of climate change, the affordable care act and its 20 new taxes, runaway regulations of the small business sectors. Most readers don’t understand the damage done by the regulators. As Cicero once said:
“The more corrupt the state the more it legislates.”
You can extend that to regulation which is a result of the laws. This administration learned its craft at the knee of Richard Daly and the Chicago style of POLITICS. Everything in the United States has been on sale to the highest bidder for the last 6 years since the chosen one was elected in 2008 with supermajorities in Congress. Pay the right price and that business becomes the turf of the crony capitalist who PAID UP. The regulations regulate the demand to their cronies and place impossible hurdles in the path of the entrepreneurs who wish to knock off the crony’s by providing more for less. People aren’t stupid contrary to Washington’s belief. They can spend their money, choose what’s right for themselves and their families in a far wiser manner than a bureaucrat or would be mandarin in the District of Corruption.
So they try and pass a law or regulation removing your ability to choose for yourself. It is an epidemic of INCONSTITUTIONAL government.
The world is unraveling at an astonishing pace. Today I will call it chart porn day. That is a day when we look at charts. Make brief comments and thoughts about them and move on to the next thought and chart.
Explosive divergence between volume and price
The first chart is brought to us by www.Zerohedge.com and it is an overlay of the vix gauge which has become totally disconnected from an perception of risk by options writers and investors complacency levels about negative events impacting the stock market such as the rise of the caliphate in Iraq;
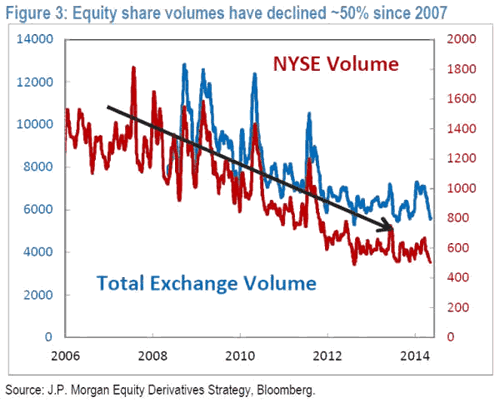
Talk about a bear market in trading volume since the peak before the financial crisis commenced. It should also be noted that as bad as the collapse in participation has been in reality it is much worse as High Frequency traders account for 50 to 70% of the trading on any particular day. I promise you that if the markets start to crash those programs will stop trading and liquidity will be reduced accordingly (50 to 70%). A mighty small door for weak handed investors that have entered late to exit. It doesn’t matter whether it is the bond markets or stocks the exits in event of a moment of panic appears very very small to me.
MORAL HAZARD written large
Moral Hazard and Complacency is at epidemic levels. Investors and Markets are TOTALLY DISCONNECTED from reality and potential risks in the global markets. They believe central banks will do anything NECCESARY to support asset values and stock markets. It is actually a correct assumption in my opinion. This is why the Middle East and ISIS taking over IRAQ dealt no blows to the markets? Let’s keep in mind that between the Federal Reserve and the Bank of Japan 110,000 million dollars is being printed each MONTH. QE is, has and will be the dominant investment theme for the foreseeable future from one central bank or another.
“The best way to destroy the capitalist system is to debauch the currency. There is no subtler, no surer means of overturning the existing basis of society than to debauch the currency. By a continuing process of inflation, governments can confiscate, secretly and unobserved, an important part of the wealth of their citizens. The process engages all of the hidden forces of economic law on the side of destruction, and does it in a manner that not one man in a million can diagnose.” – John Maynard Keynes, 1920
The BIS has reported that Thirty Trillion dollars of new debt (30 million million) has been created since the Global Financial Crisis struck in 2008 and this is a picture of it in ACTION. Powerful medicine for insolvent sovereigns, financial and mortgage markets and that money now sits in accounts around the world looking for YIELD and opportunity. All in short supply in a world where growth is OUTLAWED by socialist governments disguised as DEMOCRACY.
The Federal Reserve has gone to great lengths over the last 3 years EMPHASIZING that financial system stability is firmly one of their mandates along with unemployment and inflation. We inhabit asset backed economies with Reserveless banking systems. A move similar to 2008 will BANKRUPT the biggest financial players in banking, institutions, pensions and insurance. This anomaly and perception of a goldilocks economy and market will get eaten by the three bears before this latest episode in runaway leverage resolves itself. When this leverage fails…. THEY WILL PRINT THE MONEY.
Leverage peak in stocks?
Margin debt has always peaked before major market tops and we are now into month five since the margin peak was seen. This chart was done bywww.dshort.com;
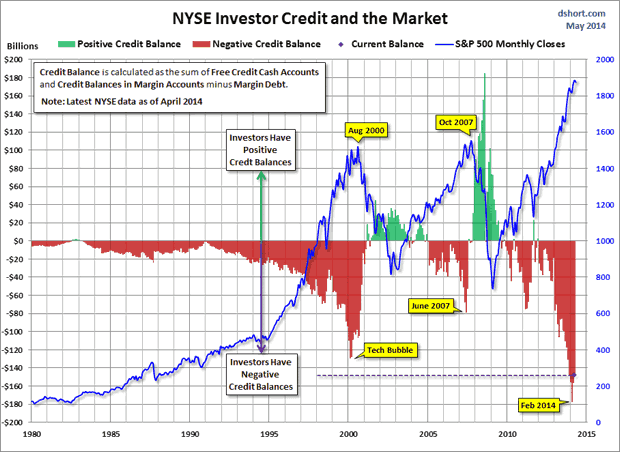
Using data compiled by Lance Roberts of STA wealth advisors. Lance and Doug are some of the finest chart makers on the web and their work must always be kept in mind. Both are Keynesians and accept official numbers as accurate. The message at this time; be afraid, be very afraid…..”
Comments »On the Matter of Money
[youtube://http://www.youtube.com/watch?v=FMF4taqaJRQ 450 300]
Comments »El-Erian: Markets Are Sprinkled With Lots of Fairy Dust
“Financial markets sure did well in the first half of the year, despite an unexpected share of economic disappointments, policy misses and geopolitical drama. They will need better news in the next six months to sustain that performance, and if they succeed it is unlikely that they will repeat those same, broad-based gains.
At the start of the year, few expected the U.S. economy to shrink by a stunning 2.9 percent in the first quarter, Russia to annex Crimea, and Iraq to fall victim to a sectarian insurgency — all of which served to amplify the challenges facing already-weak economies.
More predictable was the series of policy slips such as disappointing progress on Japan’s “third arrow” reforms and a persistently unbalanced macroeconomic stance elsewhere that relied excessively and for too long on monetary tools alone.
Yet you would be hard pressed to point to many markets that suffered any meaningful consequences. Rather than sell off, global equities have gained, as have corporate bonds, commodities and emerging-markets securities.
Historically, such broad-based gains would suggest that the global economy is improving. Not this time. Instead, analysts spent much of the first half not only lowering their growth estimates for 2014 but scaling back their assessment of even longer-term growth for a number of countries — including the U.S.
The answer to this puzzle is found in yet another asset class that did well in the first half — government bonds,including those issued by Germany and the U.S., the benchmark risk-free assets. The fact that government bonds rallied in the first half of the year speaks to the continued influence that central-bank policy wields in financial markets.
Motivated both by long-standing concerns about sluggish growth and newer worries about price deflation, the European Central Bank joined others in committing to a more stimulative monetary policy over a longer period of time…..”
Comments »Fighting Intensifies in Ukraine as Neo Nazi Party Calls Russians Sub Human
“MOSCOW—Ukrainian forces used aircraft and artillery against pro-Russian separatists in the east of the country early Tuesday, as fighting intensified after President Petro Poroshenko declared an end to a 10-day unilateral cease-fire that had failed to stop the violence.
“The active phase of the antiterrorist operation resumed this morning,” Parliament Speaker Oleksandr Turchynov, told legislators in Kiev on Tuesday. “Our armed forces are striking the bases and staging areas of the terrorists.”
The decision to use the army represents a gamble by Mr. Poroshenko that Russia won’t send in its troops, massed for months on the other side of the border, and that Kiev’s ragtag forces can oust the increasingly well-armed militants.
Fighting was reported in several areas across the region, including at posts along the Russian border that Ukrainian forces had lost to separatists in recent weeks, as well as near the international airport in Donetsk, the region’s largest city. Separatist officials also confirmed the fighting had picked up across the region.
Four civilians were killed and five wounded in the city of Kramatorsk….”
Neo Nazis Unleash Hatred in Ukraine
Comments »Glorious Chinese Manufacturng Data Gets Western Markets Giddy
“U.S. stock-index futures rose, after the Standard & Poor’s 500 Index posted the longest streak of quarterly gains since 1998, as China’s manufacturing expanded and investors awaited U.S. factory data.
Netflix Inc. (NFLX) advanced 3.4 percent in early New York trading after Goldman Sachs Group Inc. recommended investors buy shares in the world’s largest Internet-subscription service. General Motors Co. lost 0.8 percent, signaling it may decline for a fourth day. Symantec (SYMC) Corp. dropped 1.9 percent after Bank of Montreal downgraded the biggest maker of anti-virus tools to the equivalent of hold.
Futures on the S&P 500 (SPX) expiring in September climbed 0.2 percent to 1,956.9 at 7:30 a.m. in New York. The benchmark equity gauge rose 4.7 percent in the second quarter, a sixth consecutive increase. Dow Jones Industrial Average contracts added 41 points, or 0.2 percent, to 16,781 today.
“I was expecting a good performance into the summer months,” Gerhard Schwarz, the Munich-based head of equity strategy at Baader Bank AG, said by telephone. “I’ve been hoping earnings would be better. That’s what’s still missing, but the odds are quite good. Our call was that we might see some improvement in the economic indicators and that was delivered today with the Chinese PMI. So we’re seeing some recovery.”
Manufacturing Reports
A report today showed manufacturing in China expanded in June by the fastest pace this year. Apurchasing managers’ index rose to 51.0 last month from 50.8 in May, the National Bureau of Statistics and China Federation of Logistics and Purchasing said. The reading matched economists’ median estimate. A similar gauge from HSBC Holdings Plc and Markit Economics advanced to 50.7 from the previous month’s 49.4.
Figures from the Institute for Supply Management at 10 a.m. New York time may show its manufacturing index climbed to 55.9 in June from 55.4 the previous month, according to a survey of economists. That would be the highest reading of 2014…..”
Comments »