“A few notes first off…the US Dollar Index has broken below 80.0, but for this to mean anything, the US Dollar must close below 79.40 on a weekly basis. The critical levels of upper support and resistance are so tight right now, that the volatility we have seen has caused many players to go long when its wrong and go short when they should abort. The trend finally does “appear” as if the 79.40 level will break, but nothing is better than waiting for confirmation than speculation.
If the US Dollar Index does go lower, then this would allow US exports to become cheaper and further enhance the stock market. The note below is very important, so please consider this: a decline in the US Dollar Index from 80.0 to 73.0 represents a loss of 8.75%. If the S&P were to retain its S&P/US Dollar Index valuation, then it would have to rise from 1960 to 2148. So even though the S&P could rise to this level, which remains our longer-term target into August 2015 next year (Please Google Contacting Fibonacci Spiral (CFS) and CFS chiral inversion with my name to get an understanding of this longer-term stock market cycle and its implications for how things unfold into 2020), it merely becomes an extension based upon a declining currency. If the US economy strengthens, then this number could become even higher.
The outcome for such an event if it does unfold as expected (things have been going as expected, just a few bumps in the road have happened) will result in many other regions of the globe experiencing sharp reductions in global GDP and rising energy prices (since oil is primarily priced in US Dollars). Rising energy costs are instrumental in throwing the global economy into a deflationary spiral, coupled to demographics so a sharp spike in energy prices to $150-160/barrel (our target for next year) is seen as the catalyst. Based upon the chiral inversion that the CFS had last year, it is expected the market tops out next year, followed by a series of lower lows in 2016, 2018, 2019 and 2020 (3,2,1,1 to complete the Fibonacci spiral). This would be expected for the broad stock market indices of the US and not necessarily expected for commodities or their related stocks, particularly gold and silver.
A shift into gold and silver as a store of value will happen en masse once people see that governments will do whatever they can to try to steal the wealth of citizens. This will raise their sought value, alongside stocks that mine gold and silver.
The very last few charts of this update provides an update of the Elliott Wave count for the S&P 500 Index. I did not understand how this count was possible because I really doubted it. So far, it seems to be holding out and does have some interesting twists over the next 10-13 months if things continue to unfold in somewhat of an expected fashion, then the period of time between 2015 and 2020 will not be nice.
If we do get a 5 year period of cycling deflation/inflation, with the overall trend being deflationary, then keeping money in cash equivalent funds will be of utmost importance for preserving wealth. For those who can time things right, buying near the coming bottoms and selling near their short-term tops stand to generate significant returns. For those that have pension funds or RRSP’s LIRA’s etc. that are are defined contribution plans (i.e. YOUR money, not money thrown into corporate or unionized pots that are invested for everyone (think pyramid scheme)) the above may work well. In the end, those with defined contribution plans for their own pensions may see government take them over and put them into a pot…this is out of everyone’s control, but one can only do the best to preserve what they have.
Continue to pay down debt and minimally invest money into RRSP’s or LIRA’s as this could be taken over by government. Keep money in on hand investments and of course, continue to accumulate gold and silver bullion. This piece should keep everyone afloat with knowledge for what to expect over the coming 12-14 months out.
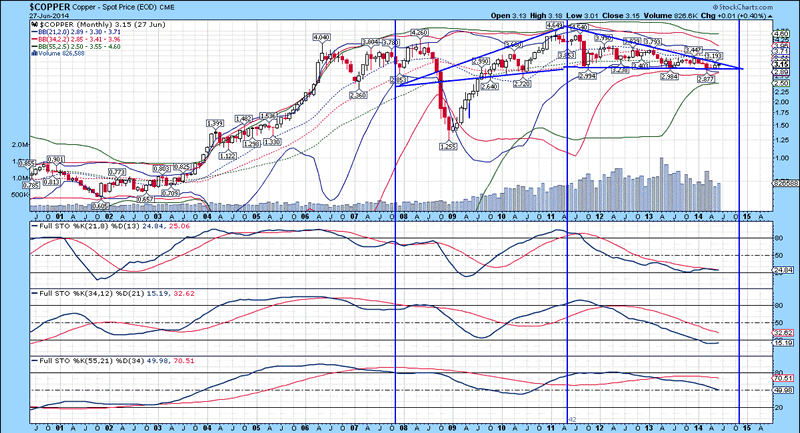
Copper Chart
I thought I would include the monthly chart of copper, because today it broke out of this very long diametric triangle structure, that has a measured move up to $4.80/pound if this analysis is correct. Bollinger bands are not providing any indication of trend, but a pop above the upper trend line (which is what has happened today) should provide further bullishness in this metal. Nickel and other base metals are rising, so copper is one of the most critical to confirm this trend. Full stochastics 1, 2 and 3 are shown below in order of descent, with the %K beneath the %D in all three instances. Extrapolation of the %K trend in stochastic 1 has yet to rise above the %D, but follow through over the next few months in copper prices would be enough to indicate a change in trend. The latter half of the diametric triangle pattern (not a diametric Elliott Wave triangle) has seen an evermore narrowing of the trading range in price. Given the way everything is expected to occur over the coming year (higher inflation due to a declining US Dollar, which further fans the global economy due to more potential for the US to export goods at cheaper prices), it stands to reason that copper prices head higher. We have one copper stock (producer/explorer) that we follow that trades well below $1/share but has significant opportunity for rising in price, pending it is not bought out beforehand.
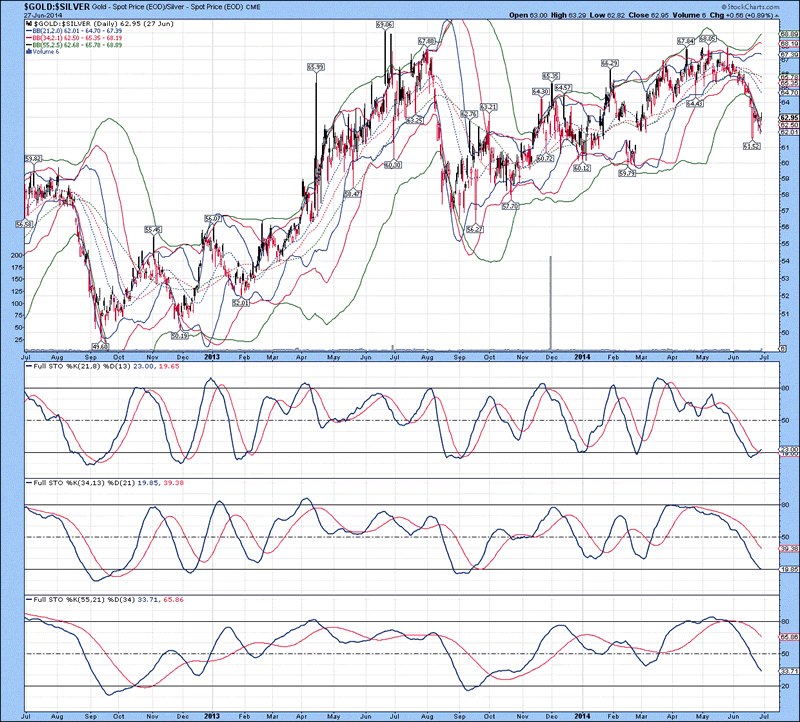
Gold Ratios
The daily chart of the gold/silver ratio is shown below, with several price excursions beyond lower Bollinger bands over the past week strongly suggests an oversold condition has been generated, which should see gold outperform silver over the course of the next few weeks. Full stochastics 1, 2 and 3 are shown below in order of descent, with the %K above the %D in 1 and beneath the %D in 2 and 3. Although there could be a change in trend with respect to the ratio, weakness could remain in effect, with a longer-term trend being down (i.e. Silver would outperform gold under this scenario).
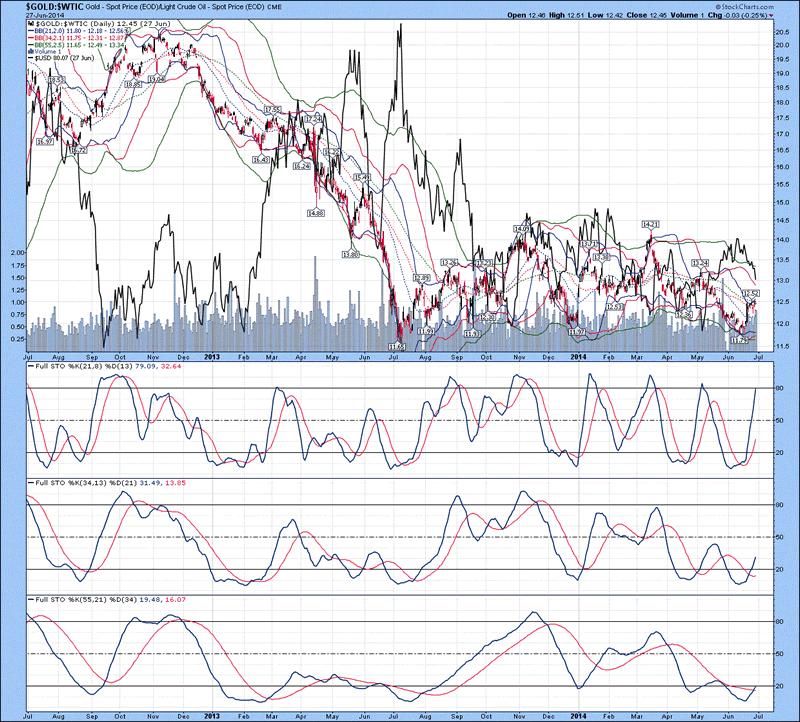
The daily chart of the gold/oil ratio index is shown below, with the US Dollar Index denoted in black. Bollinger bands are providing no indication of trend, while the %K in all three stochastics are above the %D, indicating gold is likely to continue outperforming oil over the next 5-7 weeks (based upon the depth of the %K in stochastic 3). The ratio is likely to only rise no higher than 14 over the short-term, which would represent 12% higher gold prices than current levels, assuming oil remains fixed around $105/barrel…that would work out to $1484/ounce, which is right in line with the expected high for gold over the course of the next 12-14 months. Since gold stocks generally outperform gold by a factor of 3, that would suggest the HUI tacks on around 36% above current levels, which works out to a move to 320. Things finally appear to be pointing towards higher commodity prices, but remember, THIS IS ONLY A TRADE UNTIL AROUND THIS TIME NEXT YEAR, because from late 2015 and into 2020, a severe global contraction will likely result in a bear market across many fronts. Precious metals are likely to rise in value as fewer people trust government and a rush into tangibles happens.
The weekly chart of the HUI/gold ratio is shown below, with gold denoted in black. This is probably the most important chart in the Universe for those who hold precious metal stocks, because it gives an indication of whether or not shares will outperform gold on a relative basis. Bollinger bands are extremely tight as a base has been built over the past 12 months. Based upon this, a move higher is very likely since lower lows did not happen. Full stochastics 1, 2 and 3 are shown below in order of descent, with the %K beneath the %D in 1 and above the %D in 2 and 3. Down trend lines for the %K in stochastics 2 and 3 are included which illustrates the %K in stochastic 3 breaking above its downtrend line. Notice the %K in stochastic 2 was recently repelled by this downtrend line, yet has curled up and appears set to break higher. ….”
If you enjoy the content at iBankCoin, please follow us on Twitter

