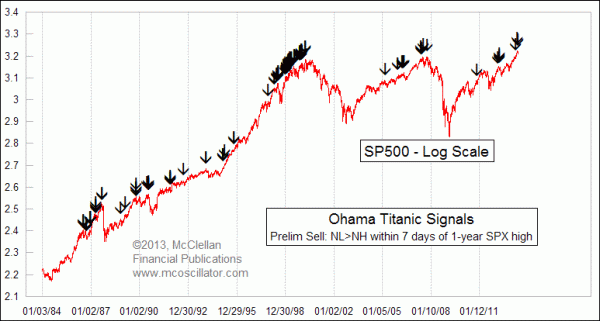
“There are two market warning signs which have just recently been triggered and which have gotten a lot of press attention due to their catchy names. The Titanic Syndrome was created in 1965 by the late Bill Ohama. It gives a “preliminary sell signal” anytime that the number of 52-week New Lows (NL) exceeds New Highs (NH) on the NYSE within 7 trading days before or after a major market high.
The top chart shows all of the instances since 1984 of these preliminary sell signals firing off. You can see that they do tend to cluster around major tops, but they also seem to cry “wolf” a lot at other times when an uptrend continues. Ohama noticed that too, and so he added further criteria to constitute what he called “additional evidence”. He wanted to see NL exceed NH for 4 out of 5 days, plus NH declining to less than 1.5% of total issues, and finally to have the DJIA (or SP500) decline for 4 out of 5 days. We now have 2 out of those 3 criteria met, but have not seen the DJIA or SP500 drop for 4 of 5 days.

In 1995, mathematician and market analyst Jim Miekka created a similarly ominous signal that came to be known as the Hindenburg Omen. It too looks at NH and NL, and was an adaptation of Gerald Appel’s “Split Market Sell Signal”. Appels signal was simply a case of seeing both NH and NL exceed 45, with no adjustment for changes in the number of issues traded. Miekka refined it by adding a few additional rules to get a more quantified signal.

Initially, Miekka set a threshold that both NH and NL had to exceed 2.2% of total NYSE issues on the same day. He later adjusted that up to 2.8% of Advances plus Declines after decimalization changed the way that issues traded, and reduced the number of unchanged issues each day. In addition, the NYSE Comp has to be above its value of 50 trading days ago, and the McClellan Oscillator has to be negative.
You may see web sites that list different criteria, based on Miekka’s earlier writings. The criteria I use are as Miekka himself reported to Greg Morris for Morris’ 2006 book, The Complete Guide to Market Breadth Indicators. Using the original 2.2% threshold, there have been 4 Hindenburg Omen signals between May 29 and June 4, 2013. Using the more up to date 2.8% threshold, there have been only 2, but that is still a significant alert to get our attention. For more on the calculations and the differences in criteria, see this 2010 article….”
If you enjoy the content at iBankCoin, please follow us on Twitter

