“Since the end of last year the bullish optimism for 2013 has risen to an almost fevered pitch. Concerns of any further disruption from the Eurozone have faded into the mist. With the“fiscal cliff” issue resolved, and little concern that the “debt ceiling” will not be raised, the worries of a domestic drag have been all but alleviated. Furthermore, despite slowing earnings and revenue growth, the outlook for 2013 earnings growth is remarkably ebullient. According to the vast majority of the media, analysts and portfolio managers there is absolutely nothing to be worried about, particularly given the fact that every major central bank is now engaged in some sort of financial easing campaign, and the markets should surge to record highs by year end.
However, maybe it is in this very optimistic outlook that we should find at least the smallest grain of concern. Bob Farrell once stated: “When all experts and forecasts agree – something else is going to happen.” As a portfolio manager I am not paid to garner portfolio returns but rather manage the risk of loss. It is in the risk management, as we discussed previously, that long term returns are achieved. It isn’t as fun, or as sexy, as driving a Ferrari at top speed but the crashes won’t kill you either.
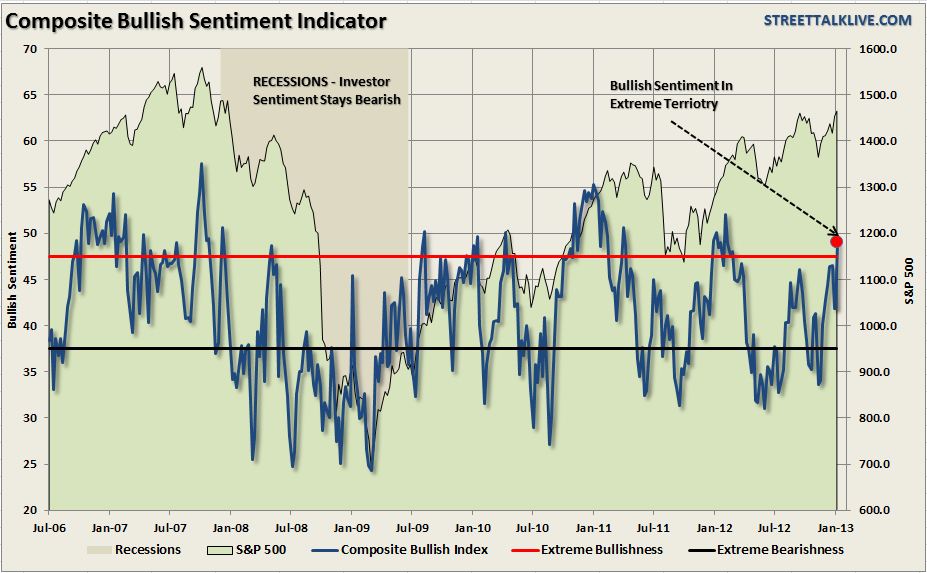
There are many ways to measure investor optimism. The chart below is the composite index of bullish sentiment of both individual and institutional investors. As you can see the index is now at levels normally associated with the beginnings of market peaks.
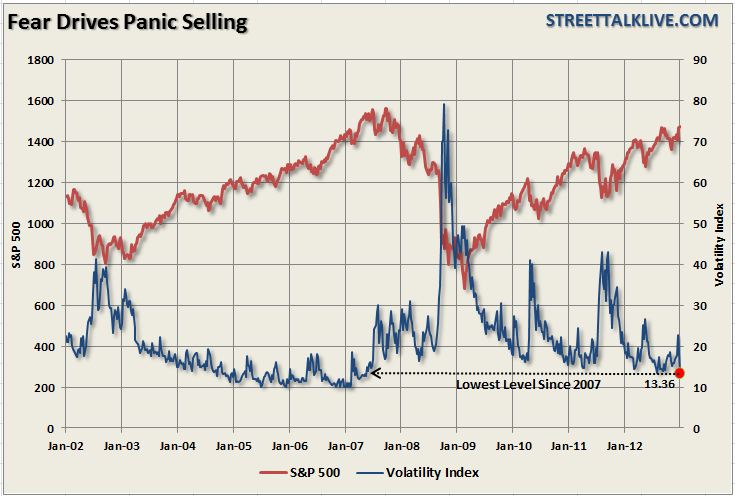
The next chart is of the Volatility Index. The volatility index, which is used as a gauge of investor fear, is currently at levels normally associated with extreme complacency. What is important to note is that the level of complacency is not the concern but rather how quickly such complacency can turn to fear.
The last chart is my composite indicator which….”
If you enjoy the content at iBankCoin, please follow us on Twitter
