iBankCoin
Home / 2011 / May (page 30)

Monthly Archives: May 2011

Felix Zulauf turns bearish, expects major correction and QE3

Barron’s Roundtable member Felix Zulauf spoke to the German-language Handelsblatt about the European sovereign debt crisis and financial markets in an article published today. Like Jeremy Grantham, he has turned bearish. Credit Writedowns has translated that article.

Title: Italy is Next

The euro will break apart. At least that is what stock market Guru Felix Zulauf expects. Handelsblatt spoke to the Swiss investment banker about his expectations for the stock market.

Frankfurt. Mr. Zulauf, you were always a big critic of the euro. How is the crisis going?

Felix Zulauf: Debt problems are never solved by more debt. In Greece, an epic drama is playing out. The Greeks are broke. The Irish are too.and the Portuguese are close.

Read the full article

Comments »

The Week Ahead

“Rising volatility in stocks and commodities could continue to be a dominant theme in the week ahead, as investors watch the latest U.S. economic reports for signs the recovery is moving forward.

Markets will also remain focused on the European debt crisis, as European heads of state meet early in the week. Greece, Portugal and Ireland are expected to dominate the discussion.

European finance ministers meet Tuesday, and the IMF, European Central Bank team spend the week in Athens. Greece is expected to present a new fiscal strategy that will include new austerity measures and privatizations, and the IMF staff may make a statement by the end of the week.

The week’s U.S. data includes a fresh look at April housing activity. Investors here will also keep a close eye on the continuing damage from rising flood waters along the Mississippi, which threatens to disrupt oil refineries.

Hewlett-Packard [HPQ  40.41   -0.47  (-1.15%)   ]Dell [DELL  16.37   -0.29  (-1.74%)   ] and a few big retailers issue earnings, including Wal-Mart [WMT  55.72 —  UNCH    ] on Tuesday.”

Full article

Comments »

Bikini Waxing Painful to Tombini Fight Against Brazil Inflation

If you’re getting a bikini wax in Brazil, you’re likely to find that the cost is rising. And if you’re an economic policy maker, that’s a problem.

As with more prosaic services ranging from car repair to dentistry, the price of waxing is rising faster than most components of the nation’s economy. That’s pushing inflation above the government’s target and may force central bank President Alexandre Tombini to prolong interest-rate increases this year.

Full story and more on Brazilian waxes here

Comments »

QE3 Prospects

“Yesterday, when we presented the Bloomberg interview of Princeton economist and former Fed vice chairman Alan Blinder, we speculated that his statement that “more easing is necessary” was the first shot across the QE3 bow. Today, Goldman’s Sven Jari Stehn has fired the second one in a paper just released titled: “Fiscal Adjustment without Fed Easing: A Tall Order” in which he basically takes our conclusion from the Blinder interview to the next level. As Blinder said previously, in order to improve the once again deteriorating labor picture, more fiscal stimulus would be necessary. That, however, is impossible, especially in a Congress where everyone is now promising $4 trillion of deficit cuts over the next few years. The only difference is how this cutting will be achieved: republicans want spending cuts, while democrats are demanding tax hikes for the richest. While neither approach will work in the US without the shock of a bond-crash induced austerity, Goldman conducts an thought experiment in which it evaluates the effectiveness of a tax-based and a spending-based fiscal consolidation. While finding that on average spending based deficit reduction is more effective, it only truly works in parallel with assistance from monetary policy: be it an interest rate decrease (impossible due to ZIRP) or further Large Scale Asset Purchase (QE) program. In other words, the only thing that can prevent an economic contraction in the next 2 years of semi-austerity, will be more monetary easing.”

Full article

Comments »

No More Melt Up Fun; Time to Act Like Mom and Pop

(Reuters) – The big money is calling a halt to the surge in stock prices.

Declines in oil and metals prices are being seen by an increasing number of fund managers and strategists as a signal to get out of riskier areas of the equity market. And that means avoiding things like Chinese IPOs and sticking to the boring stuff, like utilities.

“The growing concern is that stocks had priced in an overly optimistic economic path, and the recent breakdown in commodities and shift in equities to safer industries like health care suggest a reckoning in coming months.

Ken Fisher, founder of Fisher Investments which manages about $38 billion in equities. is among those concerned many investors have become overconfident.

“I think expectations for the stock market are a bit on the high side,” he said.”

Full article

Comments »

Army Corp To Open Spillway in Louisiana

“LAKE PROVIDENCE, La.—Army engineers prepared Saturday to slowly open the gates of an emergency spillway along the rising Mississippi River, diverting floodwaters from Baton Rouge and New Orleans, but inundating homes and farms in parts of Louisiana’s Cajun country.

About 25,000 people and 11,000 structures could be in harm’s way when the Morganza spillway is unlocked for the first time in 38 years. Sheriffs and national guardsmen were warning people in a door-to-door sweep through the area, and shelters were ready to accept up to 4,800 evacuees, Gov. Bobby Jindal said.

Some people living in the threatened stretch of countryside—an area known for small farms, fish camps and a drawling French dialect—have already started fleeing for higher ground.

“Now’s the time to evacuate,” Mr. Jindal said. “Now’s the time for our people to execute their plans. That water’s coming.”

Full article

Comments »

Hedge Funds Get Liquid To The Tune of $17 Billion in the Commodity Space

“Big hedge funds and speculators cut their bullish bets on commodity markets by $17 billion in the week through Tuesday, the biggest bear turn since at least 2009, regulatory data showed on Friday.

The so-called “managed money” funds cut their overall net long holdings in 22 U.S. futures markets by over 222,000 contracts or 13 percent in the five days ended May 10, according to Reuters calculations based on the Commodity Futures Trading Commission’s weekly Commitment of Traders.

The data, based on both futures and options positions, confirm that some big hedge funds, commodity trading advisors (CTAs) and other major speculators dramatically pared back long positions during a week in which prices abruptly collapsed before staging a modest rebound.”

Full article

Comments »

Technology Winners/Losers (1 month)

No. Ticker 1-month Return Market Cap Sector
1 SREV 43.82 1,040,000,000 TECHNOLOGY
2 SMI 43.72 3,010,000,000 TECHNOLOGY
3 VSEA 39.46 4,610,000,000 TECHNOLOGY
4 SPWRA 29.26 1,950,000,000 TECHNOLOGY
5 FEIC 27.71 1,530,000,000 TECHNOLOGY
6 CGNX 22.27 1,450,000,000 TECHNOLOGY
7 IIVI 20.89 1,690,000,000 TECHNOLOGY
8 CY 20.77 3,670,000,000 TECHNOLOGY
9 CYOU 20.42 2,190,000,000 TECHNOLOGY
10 ONNN 20.04 5,170,000,000 TECHNOLOGY
11 IPGP 19.51 3,110,000,000 TECHNOLOGY
12 NTGR 19.41 1,410,000,000 TECHNOLOGY
13 INTC 19.33 127,630,000,000 TECHNOLOGY
14 BBBB 19.27 1,550,000,000 TECHNOLOGY
15 ERTS 19.16 7,890,000,000 TECHNOLOGY
16 PLCM 19.07 5,090,000,000 TECHNOLOGY
17 ERIC 18.96 47,650,000,000 TECHNOLOGY
18 LSI 18.69 4,690,000,000 TECHNOLOGY
19 SAPE 18.14 2,000,000,000 TECHNOLOGY
20 MERU 18.03 1,810,000,000 TECHNOLOGY
21 IDTI 17.75 1,280,000,000 TECHNOLOGY
22 N 17.36 2,310,000,000 TECHNOLOGY
23 MLNX 17.18 1,080,000,000 TECHNOLOGY
24 FTNT 16.58 3,570,000,000 TECHNOLOGY
25 IGT 16.41 5,470,000,000 TECHNOLOGY
——————————————————
No. Ticker 1-month Return Market Cap Sector
1 LFT -36.39 1,080,000,000 TECHNOLOGY
2 DMD -25.64 1,020,000,000 TECHNOLOGY
3 PTI -24.12 1,070,000,000 TECHNOLOGY
4 IL -23.04 1,170,000,000 TECHNOLOGY
5 IO -21.99 1,470,000,000 TECHNOLOGY
6 RIMM -21.14 22,530,000,000 TECHNOLOGY
7 RMBS -19.44 1,630,000,000 TECHNOLOGY
8 LXK -18.98 2,360,000,000 TECHNOLOGY
9 LDK -17.54 1,410,000,000 TECHNOLOGY
10 PANL -15.68 1,780,000,000 TECHNOLOGY
11 YOKU -15.66 5,110,000,000 TECHNOLOGY
12 TSL -14.51 1,990,000,000 TECHNOLOGY
13 NTES -13.95 5,920,000,000 TECHNOLOGY
14 YGE -13.88 1,660,000,000 TECHNOLOGY
15 SOHU -13.52 3,180,000,000 TECHNOLOGY
16 FSLR -13.21 10,830,000,000 TECHNOLOGY
17 OPEN -13.02 2,190,000,000 TECHNOLOGY
18 INFY -12.95 36,300,000,000 TECHNOLOGY
19 TCL -12.94 1,410,000,000 TECHNOLOGY
20 AMX -12.73 103,060,000,000 TECHNOLOGY
21 TRMB -12.73 5,250,000,000 TECHNOLOGY
22 DST -12.68 2,200,000,000 TECHNOLOGY
23 ARRS -12.66 1,360,000,000 TECHNOLOGY
24 SFSF -12.59 2,590,000,000 TECHNOLOGY
25 LORL -11.69 2,060,000,000 TECHNOLOGY

Comments »

Utilities Winners/Losers (1 month)

No. Ticker 1-month Return Market Cap Sector
1 NRG 15.02 5,910,000,000 UTILITIES
2 FE 14.26 17,790,000,000 UTILITIES
3 UIL 13.19 1,720,000,000 UTILITIES
4 DPL 11.81 3,520,000,000 UTILITIES
5 CEG 11.72 7,370,000,000 UTILITIES
6 NWE 10.96 1,190,000,000 UTILITIES
7 D 10.17 27,630,000,000 UTILITIES
8 POM 9.92 4,520,000,000 UTILITIES
9 NI 9.82 5,700,000,000 UTILITIES
10 POR 9.46 1,940,000,000 UTILITIES
11 PNM 9.33 1,460,000,000 UTILITIES
12 AVA 9.20 1,440,000,000 UTILITIES
13 ITC 9.17 3,800,000,000 UTILITIES
14 CNP 9.16 7,970,000,000 UTILITIES
15 SO 9.05 34,380,000,000 UTILITIES
16 AEP 8.99 17,500,000,000 UTILITIES
17 TEG 8.95 4,200,000,000 UTILITIES
18 PNW 8.80 4,930,000,000 UTILITIES
19 NJR 8.36 1,860,000,000 UTILITIES
20 DTE 8.31 8,900,000,000 UTILITIES
21 OKE 8.26 7,410,000,000 UTILITIES
22 WR 8.16 3,170,000,000 UTILITIES
23 ED 8.04 15,830,000,000 UTILITIES
24 PEG 7.98 16,920,000,000 UTILITIES
25 SWX 7.91 1,850,000,000 UTILITIES

—————————————————–
No. Ticker 1-month Return Market Cap Sector
1 EBR -8.77 15,890,000,000 UTILITIES
2 ORA -8.49 1,040,000,000 UTILITIES
3 EGN -4.69 4,130,000,000 UTILITIES
4 BKH -3.02 1,240,000,000 UTILITIES
5 KMI -2.82 19,750,000,000 UTILITIES
6 AES -2.43 10,190,000,000 UTILITIES
7 GEN -2.41 2,800,000,000 UTILITIES
8 SBS -2.10 6,520,000,000 UTILITIES
9 NKA -2.07 1,410,000,000 UTILITIES
10 VE -1.88 15,190,000,000 UTILITIES
11 NFG -1.12 5,840,000,000 UTILITIES
12 ELP -0.98 7,440,000,000 UTILITIES
13 SUG 0.98 3,470,000,000 UTILITIES
14 OGE 1.07 4,990,000,000 UTILITIES
15 CPN 1.74 7,290,000,000 UTILITIES
16 APU 1.96 2,640,000,000 UTILITIES
17 UGI 2.21 3,580,000,000 UTILITIES
18 CIG 2.40 13,100,000,000 UTILITIES
19 SJI 2.51 1,670,000,000 UTILITIES
20 CNL 2.74 2,130,000,000 UTILITIES
21 HNP 2.87 6,490,000,000 UTILITIES
22 ATO 3.09 3,080,000,000 UTILITIES
23 TAC 3.32 4,830,000,000 UTILITIES
24 EIX 3.59 12,890,000,000 UTILITIES
25 NGG 3.61 32,710,000,000 UTILITIES

Comments »

Services Winners/Losers (1 month)

(Includes long and short, average volume > 25k. ETFs excluded.)

No. Ticker 1-month Return Market Cap Sector
1 DPZ 30.50 1,450,000,000 SERVICES
2 DDS 30.29 3,360,000,000 SERVICES
3 BPI 28.14 1,120,000,000 SERVICES
4 BJRI 25.10 1,330,000,000 SERVICES
5 MW 24.62 1,750,000,000 SERVICES
6 ASCA 24.10 1,340,000,000 SERVICES
7 DISH 23.82 12,810,000,000 SERVICES
8 PSMT 22.42 1,390,000,000 SERVICES
9 SIRI 21.20 8,840,000,000 SERVICES
10 MPEL 21.11 5,590,000,000 SERVICES
11 SVU 19.82 2,310,000,000 SERVICES
12 UAL 19.65 8,450,000,000 SERVICES
13 VCLK 19.58 1,430,000,000 SERVICES
14 DTG 19.53 2,370,000,000 SERVICES
15 GPRO 18.79 3,850,000,000 SERVICES
16 SBH 18.72 2,980,000,000 SERVICES
17 CPA 17.65 2,780,000,000 SERVICES
18 MHS 17.49 25,860,000,000 SERVICES
19 ROST 15.61 9,720,000,000 SERVICES
20 M 15.40 12,060,000,000 SERVICES
21 RAD 15.38 1,080,000,000 SERVICES
22 GA 14.76 2,050,000,000 SERVICES
23 VMED 14.63 10,090,000,000 SERVICES
24 LCC 14.04 1,520,000,000 SERVICES
25 FUN 13.82 1,210,000,000 SERVICES
—————————————————
No. Ticker 1-month Return Market Cap Sector
1 SVM -26.41 1,810,000,000 SERVICES
2 NYT -18.23 1,100,000,000 SERVICES
3 URI -17.84 1,630,000,000 SERVICES
4 ARO -16.94 1,760,000,000 SERVICES
5 BID -14.61 2,820,000,000 SERVICES
6 CTCM -14.54 3,050,000,000 SERVICES
7 BIG -11.51 2,900,000,000 SERVICES
8 FRO -10.29 1,610,000,000 SERVICES
9 HRB -10.25 4,830,000,000 SERVICES
10 SSI -9.92 2,030,000,000 SERVICES
11 SVN -9.51 1,010,000,000 SERVICES
12 LAMR -9.17 2,770,000,000 SERVICES
13 ALEX -9.11 1,960,000,000 SERVICES
14 IM -9.01 3,090,000,000 SERVICES
15 RCII -8.79 2,010,000,000 SERVICES
16 TRN -8.79 2,590,000,000 SERVICES
17 JNY -8.38 1,150,000,000 SERVICES
18 PSS -8.30 1,200,000,000 SERVICES
19 RRR -8.11 1,280,000,000 SERVICES
20 TGH -7.89 1,600,000,000 SERVICES
21 MSG -7.76 2,010,000,000 SERVICES
22 WCC -7.67 2,360,000,000 SERVICES
23 TAL -7.56 1,130,000,000 SERVICES
24 KNX -7.54 1,460,000,000 SERVICES
25 AEO -7.25 2,840,000,000 SERVICES

Comments »

Industrials Winners/Losers (1 month)

No. Ticker 1-month Return Market Cap Sector
1 B 18.40 1,320,000,000 INDUSTRIAL GOODS
2 TGI 17.79 2,340,000,000 INDUSTRIAL GOODS
3 HXL 16.18 2,140,000,000 INDUSTRIAL GOODS
4 HIT 15.05 254,040,000,000 INDUSTRIAL GOODS
5 GGG 14.55 3,020,000,000 INDUSTRIAL GOODS
6 MHK 12.64 4,640,000,000 INDUSTRIAL GOODS
7 SHAW 12.41 3,210,000,000 INDUSTRIAL GOODS
8 BA 10.13 58,350,000,000 INDUSTRIAL GOODS
9 ESL 9.34 2,230,000,000 INDUSTRIAL GOODS
10 ABB 9.26 59,500,000,000 INDUSTRIAL GOODS
11 ITW 8.76 28,980,000,000 INDUSTRIAL GOODS
12 AWI 8.61 2,790,000,000 INDUSTRIAL GOODS
13 LLL 8.44 8,860,000,000 INDUSTRIAL GOODS
14 FLIR 8.28 5,760,000,000 INDUSTRIAL GOODS
15 PCP 7.98 22,260,000,000 INDUSTRIAL GOODS
16 RSG 7.83 12,270,000,000 INDUSTRIAL GOODS
17 GR 7.70 11,330,000,000 INDUSTRIAL GOODS
18 MTZ 7.07 1,680,000,000 INDUSTRIAL GOODS
19 NJ 6.90 12,270,000,000 INDUSTRIAL GOODS
20 GVA 6.85 1,070,000,000 INDUSTRIAL GOODS
21 IR 5.89 16,600,000,000 INDUSTRIAL GOODS
22 IFSIA 5.86 1,230,000,000 INDUSTRIAL GOODS
23 LFUS 5.73 1,310,000,000 INDUSTRIAL GOODS
24 UTX 5.65 81,440,000,000 INDUSTRIAL GOODS
25 HON 5.58 47,620,000,000 INDUSTRIAL GOODS
————————————————————–
1 GFA -17.18 2,320,000,000 INDUSTRIAL GOODS
2 MDR -14.15 4,790,000,000 INDUSTRIAL GOODS
3 DGI -14.12 1,120,000,000 INDUSTRIAL GOODS
4 MTW -13.21 2,370,000,000 INDUSTRIAL GOODS
5 X -11.67 6,420,000,000 INDUSTRIAL GOODS
6 GTLS -11.58 1,290,000,000 INDUSTRIAL GOODS
7 USG -11.53 1,490,000,000 INDUSTRIAL GOODS
8 TPC -11.18 1,050,000,000 INDUSTRIAL GOODS
9 WPRT -9.84 1,060,000,000 INDUSTRIAL GOODS
10 ROK -9.47 11,910,000,000 INDUSTRIAL GOODS
11 VMC -8.49 5,160,000,000 INDUSTRIAL GOODS
12 JOYG -7.74 9,170,000,000 INDUSTRIAL GOODS
13 DRC -7.55 3,620,000,000 INDUSTRIAL GOODS
14 TXT -7.52 6,800,000,000 INDUSTRIAL GOODS
15 EXP -7.48 1,190,000,000 INDUSTRIAL GOODS
16 TXI -7.42 1,080,000,000 INDUSTRIAL GOODS
17 CNH -6.89 10,070,000,000 INDUSTRIAL GOODS
18 RS -6.88 3,830,000,000 INDUSTRIAL GOODS
19 BWC -6.60 3,320,000,000 INDUSTRIAL GOODS
20 NDSN -6.34 3,540,000,000 INDUSTRIAL GOODS
21 DE -6.25 36,930,000,000 INDUSTRIAL GOODS
22 PH -6.11 14,190,000,000 INDUSTRIAL GOODS
23 LPX -6.08 1,120,000,000 INDUSTRIAL GOODS
24 CX -6.08 8,510,000,000 INDUSTRIAL GOODS
25 EMR -5.89 40,240,000,000 INDUSTRIAL GOODS

Comments »

Healthcare Winners/Losers (1 month)

No. Ticker 1-month Return Market Cap Sector
1 AMRN 94.94 1,820,000,000 HEALTHCARE
2 TRNX 35.00 4,800,000,000 HEALTHCARE
3 ALKS 30.80 1,390,000,000 HEALTHCARE
4 ONXX 28.44 2,720,000,000 HEALTHCARE
5 ZOLL 28.38 1,290,000,000 HEALTHCARE
6 HLF 25.16 6,360,000,000 HEALTHCARE
7 THOR 22.50 1,930,000,000 HEALTHCARE
8 MYGN 21.49 2,070,000,000 HEALTHCARE
9 VRTX 21.31 11,810,000,000 HEALTHCARE
10 AMLN 19.70 1,930,000,000 HEALTHCARE
11 BIIB 19.32 23,340,000,000 HEALTHCARE
12 WCG 18.89 2,100,000,000 HEALTHCARE
13 QCOR 18.71 1,410,000,000 HEALTHCARE
14 REGN 18.48 4,820,000,000 HEALTHCARE
15 NUVA 17.62 1,240,000,000 HEALTHCARE
16 AET 17.15 15,890,000,000 HEALTHCARE
17 MR 16.56 3,560,000,000 HEALTHCARE
18 CBST 16.10 2,090,000,000 HEALTHCARE
19 WLP 16.07 29,460,000,000 HEALTHCARE
20 HS 15.65 2,940,000,000 HEALTHCARE
21 SGEN 15.45 2,050,000,000 HEALTHCARE
22 ZMH 15.02 13,220,000,000 HEALTHCARE
23 ELN 14.95 4,960,000,000 HEALTHCARE
24 UHS 14.36 5,270,000,000 HEALTHCARE
25 TMH 13.96 1,420,000,000 HEALTHCARE
——————————————————-
No. Ticker 1-month Return Market Cap Sector
1 JAZZ -17.19 1,150,000,000 HEALTHCARE
2 ITMN -16.50 2,210,000,000 HEALTHCARE
3 CYH -12.21 2,640,000,000 HEALTHCARE
4 NXTM -11.40 1,090,000,000 HEALTHCARE
5 MASI -8.20 1,880,000,000 HEALTHCARE
6 HGSI -7.54 5,160,000,000 HEALTHCARE
7 PPDI -6.85 3,250,000,000 HEALTHCARE
8 AH -6.06 2,400,000,000 HEALTHCARE
9 EXEL -5.11 1,400,000,000 HEALTHCARE
10 CRL -4.78 2,040,000,000 HEALTHCARE
11 VRX -4.74 15,230,000,000 HEALTHCARE
12 THC -3.21 3,100,000,000 HEALTHCARE
13 NVO -3.18 70,960,000,000 HEALTHCARE
14 VPHM -3.01 1,440,000,000 HEALTHCARE
15 RMD -2.17 4,820,000,000 HEALTHCARE
16 DNDN -1.99 5,550,000,000 HEALTHCARE
17 HSP -1.91 9,310,000,000 HEALTHCARE
18 ALXN -1.75 9,150,000,000 HEALTHCARE
19 BSX -1.72 10,450,000,000 HEALTHCARE
20 ISRG -1.72 13,990,000,000 HEALTHCARE
21 MAKO -1.58 1,030,000,000 HEALTHCARE
22 DVA -1.28 8,170,000,000 HEALTHCARE
23 PRGO -1.03 8,030,000,000 HEALTHCARE
24 BLUD -1.00 1,460,000,000 HEALTHCARE
25 BKD -0.73 3,120,000,000 HEALTHCARE

Comments »

Financial Winners/Losers (1 month)

No. Ticker 1-month Return Market Cap Sector
1 CSGP 19.13 1,490,000,000 FINANCIAL
2 TW 15.11 4,700,000,000 FINANCIAL
3 CHSI 14.96 2,840,000,000 FINANCIAL
4 AGO 14.53 3,080,000,000 FINANCIAL
5 UMBF 12.85 1,700,000,000 FINANCIAL
6 OCN 12.36 1,210,000,000 FINANCIAL
7 SLG 12.35 6,790,000,000 FINANCIAL
8 CSH 11.21 1,400,000,000 FINANCIAL
9 PRA 10.38 2,100,000,000 FINANCIAL
10 BEE 10.33 1,160,000,000 FINANCIAL
11 RYN 9.95 5,380,000,000 FINANCIAL
12 CBL 9.81 2,790,000,000 FINANCIAL
13 SPG 9.76 33,810,000,000 FINANCIAL
14 AFSI 9.57 1,160,000,000 FINANCIAL
15 TCO 9.57 3,270,000,000 FINANCIAL
16 BXP 9.53 14,610,000,000 FINANCIAL
17 CXW 9.27 2,790,000,000 FINANCIAL
18 SKT 9.21 2,230,000,000 FINANCIAL
19 ADS 8.95 4,640,000,000 FINANCIAL
20 WRI 8.94 3,190,000,000 FINANCIAL
21 STSA 8.81 1,100,000,000 FINANCIAL
22 PVTB 8.74 1,100,000,000 FINANCIAL
23 VNO 8.73 17,460,000,000 FINANCIAL
24 KIM 8.71 7,720,000,000 FINANCIAL
25 IVR 8.68 1,140,000,000 FINANCIAL
————————————————–
No. Ticker 1-month Return Market Cap Sector
1 NBG -22.22 6,690,000,000 FINANCIAL
2 AIB -21.58 3,980,000,000 FINANCIAL
3 IRE -16.44 2,420,000,000 FINANCIAL
4 BXS -15.48 1,080,000,000 FINANCIAL
5 GS -11.63 77,390,000,000 FINANCIAL
6 SF -11.39 2,070,000,000 FINANCIAL
7 BMA -11.30 2,050,000,000 FINANCIAL
8 HXM -11.14 1,390,000,000 FINANCIAL
9 JNS -10.95 2,030,000,000 FINANCIAL
10 BCS -10.87 53,060,000,000 FINANCIAL
11 LYG -10.74 58,940,000,000 FINANCIAL
12 ENH -10.71 1,690,000,000 FINANCIAL
13 AEG -10.68 11,910,000,000 FINANCIAL
14 GNW -10.60 5,500,000,000 FINANCIAL
15 JLL -10.17 4,060,000,000 FINANCIAL
16 AIG -10.13 55,120,000,000 FINANCIAL
17 BAC -10.10 120,890,000,000 FINANCIAL
18 CSE -10.00 2,000,000,000 FINANCIAL
19 MS -9.78 36,490,000,000 FINANCIAL
20 SNV -9.77 1,880,000,000 FINANCIAL
21 LFC -9.38 96,920,000,000 FINANCIAL
22 AUTC -9.22 1,490,000,000 FINANCIAL
23 BFR -9.03 1,720,000,000 FINANCIAL
24 BBVA -8.94 51,930,000,000 FINANCIAL
25 HDB -8.68 24,510,000,000 FINANCIAL

Comments »

Consumer Goods Winners/Losers (1 month)

No. Ticker 1-month Return Market Cap Sector
1 DF 35.56 2,460,000,000 CONSUMER GOODS
2 RAH 31.11 4,970,000,000 CONSUMER GOODS
3 NUS 26.84 2,340,000,000 CONSUMER GOODS
4 POOL 20.94 1,460,000,000 CONSUMER GOODS
5 CROX 19.42 1,900,000,000 CONSUMER GOODS
6 UFS 18.70 4,320,000,000 CONSUMER GOODS
7 GT 18.45 4,340,000,000 CONSUMER GOODS
8 IMAX 18.17 2,360,000,000 CONSUMER GOODS
9 ICON 15.57 1,790,000,000 CONSUMER GOODS
10 MJN 14.61 13,960,000,000 CONSUMER GOODS
11 HBI 14.47 3,080,000,000 CONSUMER GOODS
12 LEG 14.33 3,710,000,000 CONSUMER GOODS
13 GNTX 13.94 4,420,000,000 CONSUMER GOODS
14 DAR 13.70 2,010,000,000 CONSUMER GOODS
15 COLM 13.46 2,330,000,000 CONSUMER GOODS
16 WBC 13.36 4,660,000,000 CONSUMER GOODS
17 PII 13.18 3,530,000,000 CONSUMER GOODS
18 GMCR 13.11 10,730,000,000 CONSUMER GOODS
19 LO 13.04 16,020,000,000 CONSUMER GOODS
20 DMND 13.01 1,490,000,000 CONSUMER GOODS
21 BCPC 12.86 1,180,000,000 CONSUMER GOODS
22 VRA 12.44 2,060,000,000 CONSUMER GOODS
23 OI 12.09 5,410,000,000 CONSUMER GOODS
24 CSL 11.47 3,000,000,000 CONSUMER GOODS
25 SHOO 11.34 1,540,000,000 CONSUMER GOODS
———————————————————–
No. Ticker 1-month Return Market Cap Sector
1 PPC -21.96 1,200,000,000 CONSUMER GOODS
2 TBL -21.40 1,740,000,000 CONSUMER GOODS
3 HNI -15.24 1,150,000,000 CONSUMER GOODS
4 PAY -14.74 4,160,000,000 CONSUMER GOODS
5 SFD -11.53 3,410,000,000 CONSUMER GOODS
6 BC -11.12 1,940,000,000 CONSUMER GOODS
7 UA -10.74 3,460,000,000 CONSUMER GOODS
8 CCH -10.64 9,290,000,000 CONSUMER GOODS
9 OSK -10.07 2,680,000,000 CONSUMER GOODS
10 GMK -9.18 1,020,000,000 CONSUMER GOODS
11 ADM -8.34 21,650,000,000 CONSUMER GOODS
12 GNRC -8.05 1,230,000,000 CONSUMER GOODS
13 SNE -7.32 27,710,000,000 CONSUMER GOODS
14 LII -7.16 2,570,000,000 CONSUMER GOODS
15 PHG -6.80 27,410,000,000 CONSUMER GOODS
16 SAM -6.27 1,120,000,000 CONSUMER GOODS
17 WRC -6.01 2,490,000,000 CONSUMER GOODS
18 TTM -5.35 15,170,000,000 CONSUMER GOODS
19 CZZ -5.32 2,990,000,000 CONSUMER GOODS
20 HOG -5.11 9,010,000,000 CONSUMER GOODS
21 XRX -4.89 14,310,000,000 CONSUMER GOODS
22 TSN -4.68 7,000,000,000 CONSUMER GOODS
23 DBD -4.43 2,160,000,000 CONSUMER GOODS
24 SWFT -4.00 1,860,000,000 CONSUMER GOODS
25 PCH -3.81 1,490,000,000 CONSUMER GOODS

Comments »

Basic Material Winners/Losers (1 month)

No. Ticker 1-month Return Market Cap Sector
1 ICO 36.29 2,930,000,000 BASIC MATERIALS
2 RTI 27.11 1,140,000,000 BASIC MATERIALS
3 CRS 26.63 2,260,000,000 BASIC MATERIALS
4 CRR 20.23 3,560,000,000 BASIC MATERIALS
5 PPO 18.16 3,030,000,000 BASIC MATERIALS
6 ALB 18.04 6,330,000,000 BASIC MATERIALS
7 GRA 17.27 3,230,000,000 BASIC MATERIALS
8 CE 15.91 8,070,000,000 BASIC MATERIALS
9 AHD 15.28 1,290,000,000 BASIC MATERIALS
10 NEU 14.43 2,420,000,000 BASIC MATERIALS
11 POL 10.71 1,350,000,000 BASIC MATERIALS
12 OMG 10.44 1,120,000,000 BASIC MATERIALS
13 MIC 10.43 1,150,000,000 BASIC MATERIALS
14 EMN 8.61 7,430,000,000 BASIC MATERIALS
15 ASH 8.42 4,840,000,000 BASIC MATERIALS
16 SIAL 8.28 8,390,000,000 BASIC MATERIALS
17 RGLD 7.79 3,150,000,000 BASIC MATERIALS
18 TIE 7.69 3,460,000,000 BASIC MATERIALS
19 APL 7.66 1,750,000,000 BASIC MATERIALS
20 TNH 7.61 2,120,000,000 BASIC MATERIALS
21 KWK 7.37 2,450,000,000 BASIC MATERIALS
22 ATI 7.23 6,810,000,000 BASIC MATERIALS
23 ROC 7.22 3,850,000,000 BASIC MATERIALS
24 SWN 7.21 14,300,000,000 BASIC MATERIALS
25 EC 6.66 84,970,000,000 BASIC MATERIALS
———————————————————–
No. Ticker 1-month Return Market Cap Sector
1 CDE -25.21 2,260,000,000 BASIC MATERIALS
2 PAAS -21.96 3,460,000,000 BASIC MATERIALS
3 AG -21.95 1,850,000,000 BASIC MATERIALS
4 NG -19.75 2,410,000,000 BASIC MATERIALS
5 SLW -19.60 12,040,000,000 BASIC MATERIALS
6 BEXP -19.38 3,150,000,000 BASIC MATERIALS
7 FOE -19.35 1,080,000,000 BASIC MATERIALS
8 GPOR -19.15 1,200,000,000 BASIC MATERIALS
9 MFN -18.77 1,010,000,000 BASIC MATERIALS
10 NOG -17.75 1,220,000,000 BASIC MATERIALS
11 NAK -16.96 1,140,000,000 BASIC MATERIALS
12 SSRI -16.27 2,260,000,000 BASIC MATERIALS
13 NSU -15.26 1,070,000,000 BASIC MATERIALS
14 ANV -14.87 3,060,000,000 BASIC MATERIALS
15 NGD -14.73 3,720,000,000 BASIC MATERIALS
16 SWC -14.40 1,870,000,000 BASIC MATERIALS
17 EGO -14.33 8,290,000,000 BASIC MATERIALS
18 TC -14.18 1,780,000,000 BASIC MATERIALS
19 MTL -13.92 10,370,000,000 BASIC MATERIALS
20 CENX -13.88 1,460,000,000 BASIC MATERIALS
21 GFI -13.70 11,060,000,000 BASIC MATERIALS
22 CVI -13.70 1,670,000,000 BASIC MATERIALS
23 ABX -13.69 46,810,000,000 BASIC MATERIALS
24 IPI -13.67 2,180,000,000 BASIC MATERIALS
25 XEC -13.63 7,920,000,000 BASIC MATERIALS

Min mkt cap 1bill

Comments »

Fast Times at Hugh Hendry High

_______________

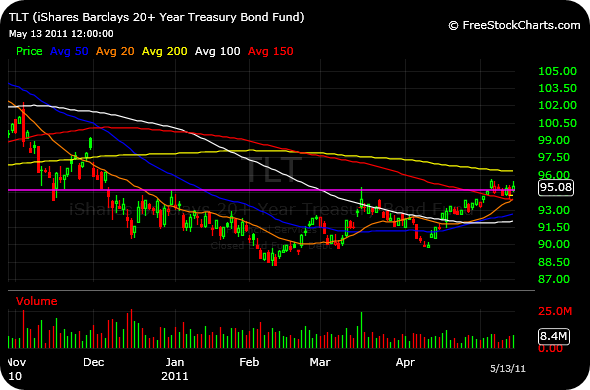
Bonds have been seeing nice inflows recently, making our beloved U.S Government bond bull and British hedge fund manager Hugh Hendry relevant again. Exhibit A: TLT threatening a major breakout.

_______________

Comments »

Biggest ETF Winners/Losers For the Week

No. Ticker 1-week Return
1 EDZ 8.37
2 LHB 7.90
3 DUST 7.64
4 BZQ 6.73
5 EEV 5.86
6 SGG 5.50
7 FAZ 4.73
8 EWV 4.40
9 HPI 4.10
10 XIV 4.00
11 SMN 3.99
12 ERY 3.90
13 APF 3.79
14 DRR 3.70
15 HPF 3.68
16 SGAR 3.67
17 DPK 3.48
18 KHI 3.45
19 PMR 3.41
20 EUM 3.30
21 EUO 3.30
22 SKF 3.26
23 BBH 3.25
24 PBJ 3.23
25 SAA 3.02

——————————–

No. Ticker 1-week Return
1 ZSL -12.81
2 SQQQ -10.06
3 TVIX -8.91
4 EDC -8.69
5 LBJ -8.35
6 AGQ -8.34
7 NUGT -7.99
8 TUR -7.74
9 GDXJ -6.05
10 JO -5.65
11 EZA -5.47
12 CAFE -5.43
13 EET -5.36
14 CEE -5.35
15 GAF -5.11
16 SIL -5.05
17 DZK -5.03
18 CTNN -4.94
19 ERX -4.93
20 FAS -4.91
21 CVOL -4.59
22 UYM -4.49
23 VXX -4.39
24 ASA -4.36
25 VIIX -4.30

Comments »

Biggest Winners/Losers For the Week

No. Ticker 1-week Return
1 ARTX 87.60
2 VRML 59.19
3 ABCW 30.51
4 SREV 28.52
5 ONTY 27.74
6 FFHL 27.70
7 TREE 27.50
8 HCKT 27.44
9 CKXE 26.98
10 VICL 24.66
11 DF 24.11
12 SCLN 23.86
13 PKT 23.73
14 GRNB 22.32
15 ALKS 22.18
16 MSHL 22.13
17 SPA 21.16
18 MED 20.55
19 IPSU 20.32
20 CYCC 19.86
21 ROVI 19.77
22 PRKR 19.35
23 FSII 18.57
24 AVEO 18.46
25 RPTP 17.82
——————————-
No. Ticker 1-week Return

2 JTX -47.11
3 IBNK -41.67
4 JGBO -39.49
5 PNSN -36.64
6 HEV -36.44
7 BMTI -36.27
8 REVU -32.26
9 PAL -29.11
10 TNGN -28.85
11 HEAT -27.85
12 RCON -26.42
13 HRZ -26.29
14 STEC -26.04
15 RENN -25.77
16 VTRO -25.58
17 SPMD -23.35
18 TBSI -22.94
19 IL -22.60
20 HW -22.38
21 USNA -22.28
22 BLTI -21.95
23 DHRM -21.73
24 TRGL -21.56
25 CWS -20.88

Comments »