Can still post?
Stay Paid
Stay Paid
NES Revisited – Harper Strokes Out

Someone with a modicum of class would probably let this week’s update from NES slide since there is nothing to gain from rejoicing in the pain of others. I am not that someone. There was too much shittiness in that update to let it go without chiming in.
Let’s dissect the 8K point by point:
Nuverra expects to report revenues for the second quarter of approximately $165.5 million and adjusted EBITDA2 in the range of $32.8 million to $33.6 million.
Well, that’s a straight kick in the gonads. A 3.7% sequential revenue growth rate does not exactly make for a “high growth” stock. Taking the midpoint of their bullshit “adjusted EBITDA” range provides an EBITDA margin of 20%. This is the same company that claimed they could maintain 30 – 40% margins while rapidly growing revenues.
They were gracious enough to provide a reconciliation between normal EBITDA and their trumped up version of a non-GAAP measure. Regular old EBITDA is projected to be a pissy $23.4 mln again using midpoint figures. That’s a smoooooth 14% EBITDA margin. Yours truly in The PPT projected their margins would come down to the 20 – 15% range. Recognize.
The Company expects cash capital expenditures during the quarter to be approximately $8.2 million
Nice. CAPEX through 2Q this year is slightly higher than last year despite the company carrying 2.6x the amount of assets now compared to last year. Don’t give me that shit about growth CAPEX vs. maintenance CAPEX. The company is in bad shape; pure and simple.
Activity levels in the Shale Solutions segment lagged the Company’s internal forecast, as customers increased activity at a slower pace than originally anticipated, pushing revenue into the second half of 2013 and 2014.
Translated: The growth ain’t there kids.
Unusually harsh weather conditions in the Bakken Shale area, the Company’s largest region of operations, adversely impacted customer completion activity, as high levels of snow and rain hampered vehicle access to roads.
Diversification… get some. Let me give you a free heads up; it’s going to be cold in North Dakota next winter, the winter after that, the one after that, etc. It also tends to rain a little bit up there this time of year.
Operational issues in the Eagle Ford Shale area, a key 2013 growth area for the Company, caused business operations to decline sequentially. Nuverra has taken measures to remedy the situation by bringing in a new management team with significant industry experience and restructuring operations in the region.
This one RIGHT HERE is the red flag of all red flags. We’re talking the Kremlin on May Day back in the 60’s kind of red flags.

When you compete in a highly competitive business, you get one shot and one shot only. NES has already blown their chance. They touted the additions of a couple of former HAL managers earlier this quarter making it sound like they poached the guys. Wrong. Neither one of those guys has worked for HAL in three years. One guy left HAL around 2005.
They can talk about making the management changes until they’re blue in the face but it won’t mean a damn thing until the next 20 companies screw up. If you lose a job due to lack of performance you’re relegated to the back of the queue. That’s how this business works no matter what someone with a cool ass Public Relations degree will tell you. BTW, nice couch, brah.
Stronger than anticipated customer demand in the Marcellus/Utica Shale area led to an increased utilization of subcontractors, resulting in lower overall margins.
So much for that management dream team, I guess. Good management can properly you know… manage their growth. These guys look clueless.
The Company also recently completed an acquisition in the Utica Shale area to expand operations and build on its existing presence in a basin that is very strategic to the Company’s growth plans.
Wonder if this was done prior to quarter end or after June 30? If it was done during 2Q then the $165.5 mln in revenue is even more craptastic than originally thought.
In the Industrial Solutions segment, higher collection and rail logistics costs coupled with stagnant demand in asphalt markets compressed margins and resulted in lower than anticipated financial results.
This is the segment that is supposed to provide a buffer against the cyclical nature of the oil and gas portion of the business. Looks like it’s not performing up to snuff either. Big shock.
Let’s wrap this up by talking a little bit about the deal they recently inked with HAL. This deal is being touted by all sorts of message board peeps as a game changer. It’s revolutionary in nature and will be the catalyst to send NES shares to da moon. Three words… Bull. Fucking. Shit.
No financial terms were disclosed, and it was quite apparent from the press release that NES will be handling the trucking and storing of fluids. That’s not where the money gets made in this kind of deal. Whoever is processing the water, supplying the treatment chemicals and other services will make the bones. Based on nothing more than how the press release was worded I have to believe HAL is the one doing all that.
Conclusion: Avoid this stock. I would not recommend a short position because thinly traded stocks that get pumped on Seekingalpha can burn your ass. But this company is shaping up to be the quintessential value trap. If you think it’s going to be a long term 10 bagger, you’re going to be sorely disappointed.
[youtube:http://www.youtube.com/watch?v=PqKq_kGEtkU 450 300]
A little something about NES

Before you throw money at former Cramer favorite and Seeking Alpha pump and dump promotion, NES, consider this:
1) The company went out and paid top dollar for a Bakken region water disposal company. As a result the company was able to throw out the words “Bakken”, “shale oil”, “energy independent” blah blah blah in their future press releases. The timing of this acquisition sucked balls as they made the purchase pretty much at the very peak of Bakken activity.
2) Other companies have mentioned moving assets out of the Bakken because margins are getting hit left, right and center. Just like usual, when the oilfield finds a good thing they will grind it into sawdust and ruin it for everyone.
3) The company took on a shit ton of debt to make the acquisition. Debt went from $144 mln at the end of 2011 to $566 mln at the end of 2012. Current total debt is roughly in line with YE 2012 figures.
4) As a result of the debt increase, interest expense soared from $4 mln to $27 mln over the last year.
5) The vast majority of the company’s (cough cough) “earnings” come from huge tax benefits. For example in 2012 NES reported $2.5 mln in net income, but they received a smooooooth $58.6 mln tax benefit. Someone is not eating their peas.
6) Remember how I pointed out they made a big acquisiton? Well as a result of said transaction depreciation went up as expected from $21.4 mln to $42 mln. No problem there. The problem is that at the same time they drastically cut CAPEX. CAPEX dropped from $151 mln to $46 mln. If CAPEX doesn’t pick up to replace aging assets then this is a covert liquidation in process.
7) Lastly, they want to be known as an environmental company because those types of companies command higher multiples. They even went and changed the company name to some bad ass sounding, new age, hippified bullshit moniker. Still the same water hauling shit heap as before but now they got a cool name. Unfortunately for them, the market is on to this fucktardedness.
8) There’s a more than slight chance they are cooking their books. Behold the Beneish Earnings Manipulation Model results for NES:
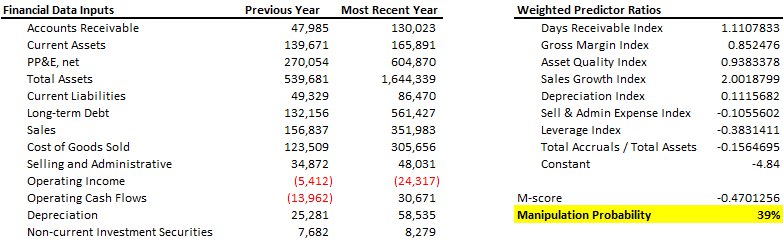
If you’re wondering what the hell a Beneish Earnings Manipulation Model is, google it. It’s not a sure fire way to predict financial chicanery but it does raise eyebrows when you get a score such as the above.
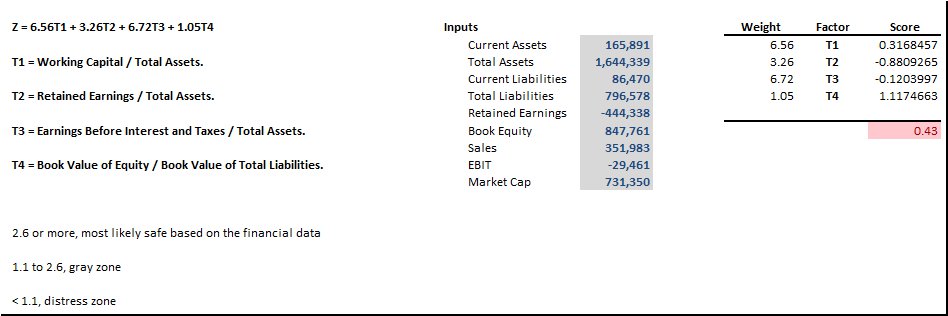
9) There’s a decent enough chance they will go bankrupt based on their Altman-Z score (again, google it if you don’t know what it is):
Po Pimp Capital has a “Chickenhead” rating on shares of NES. I would probably buy shares in WFT before this dung heap.
[youtube:http://www.youtube.com/watch?v=X0pUwmoliEo 450 300]
SLB goes Countrywide, bitches

The hell?
One of SLB’s core precepts is was it would not take equity stakes in clients’ reserves. The old guard at SLB thought it might be a bad idea to compete against their customers. Novel thought, right? Well the new crew led by one-year CEO Paal Kibsgaard decided those OGs didn’t know what the fuck they were doing. I don’t know if this has anything to do with the resignation of the former COO two weeks ago or not, but the timing is suspicious.
Apparently Paal and his crew rolled up to FST and offered them a drilling carry on some of their Eagle Ford acreage. Since this was such a complete 180 from previous company policy it was brought up in last month’s earnings call. Paal said it was the only way to make the deal work so they went with it; but they won’t do it again (ha ha ha ha ha). In other words, FST didn’t have the cash to pay for SLB’s services but SLB was hell bent on doing the deal. Hmmmmmmm.
Now we shift focus to what is going on down in Venezuela. Last Q all the big service companies suffered impairments due to the devaluation of Venezuela’s currency. Shit happens, this is not a big surprise. It’s not the first time it’s happened nor will it be the last. Call it a cost of business for working down there.
No, the interesting part comes from yesterday’s announcement (http://on.wsj.com/10ZABHN) that SLB has extended PDVSA (the Venezuela state run oil company) a $1 billion revolving credit facility. Are you fucking shitting me? Companies aren’t sure they are going to get paid by these deadbeats and Paal decides to float a $1 billion revolver their way.
Has SLB become the sub-prime lender in the oil patch?
[youtube:http://www.youtube.com/watch?v=SKfTTGnWnKA 450 300]
Quick and Dirty Valuation Example

So you want to do a quick valuation?
No, this article is not going to have you competing against Wharton MBA’s or anything but sometimes you just need quick and dirty. Maybe you have a kegger to attend and don’t have time to build a full-scale financial model. The premise we will use is a multiple analysis. I’ll use $AAPL as an example because everyone and their dog has an opinion about it. There’ s not much if any hidden value or traps lurking out there. If you know the first thing about valuations already, feel free to skip this. You won’t learn anything new.
The idea is that over time a company is going to ebb and flow but revert back to some average performance levels. In order to get started we’re going to need a few pieces of important data. The main things we’re interested in are revenue estimates for the next year, shares outstanding, historical margins, and typical P/E ratios.
Everyone likes to rag on Yahoo! Finance and that’s fine. But not everyone has access to a Bloomberg terminal or FactSet consensus numbers. For our purposes Yahoo will suffice.
First step is to go to the “Key Statistics” for $AAPL and get the shares outstanding. You’ll find them on the right hand side about half way down the page.
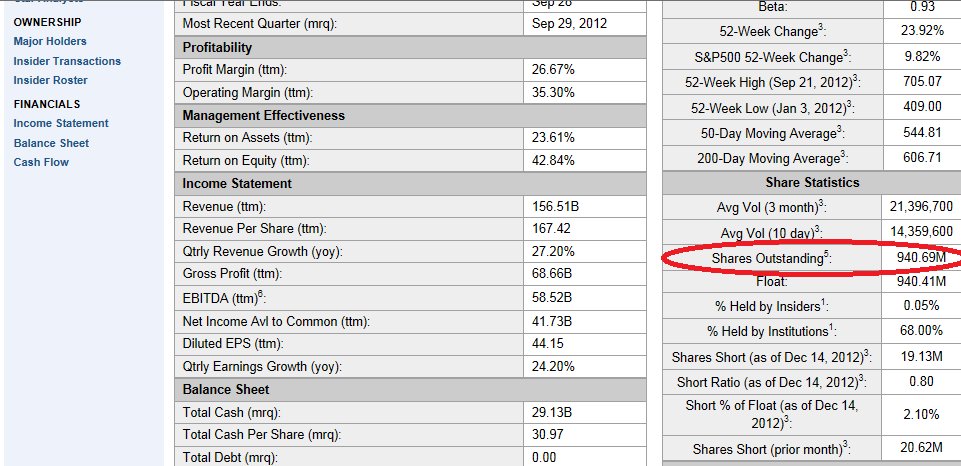
Shares outstanding is 940.69M.
Now we want the revenue estimate for 2013. Go to the “Analysts Estimates” link on the stock in question ($AAPL)
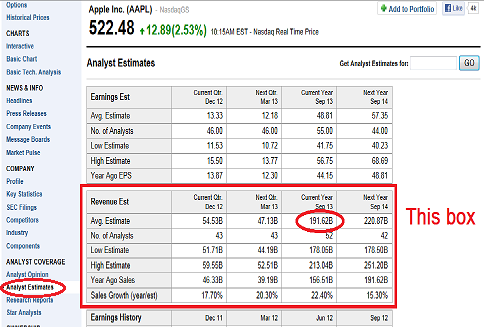
After that, look in the second box for revenue estimates. Find the estimate for 2013. In this case it’s $191.62B. Alright that was easy enough. Now what about that other bullshit like historical margins and P/E ratios?
We’re in luck as we can use some more free stuff from Morningstar for this part of the puzzle. Go to:
http://financials.morningstar.com/valuation/price-ratio.html?t=AAPL®ion=USA&culture=en-us
If you’re doing a different company then change AAPL in the above link to your symbol of choice. If you think you might be doing this a few times go ahead and save a bookmark so you can get back here easy enough. For other stocks you can either change the symbol in the link or put it in the ‘Quote’ box up at the top of the page.
What we want to do on this page is scroll about halfway down to the “Valuation History” section. Under the bar charts you’ll see “Price/Earnings”
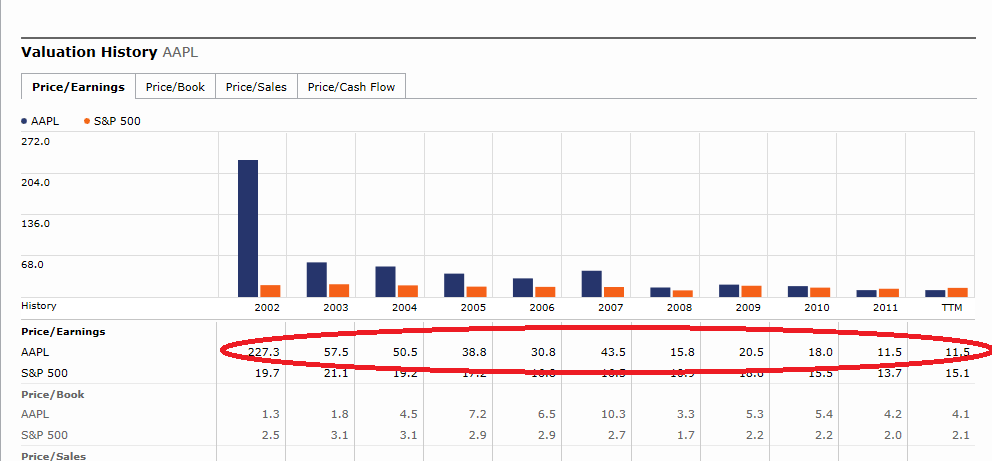
Apologies, but that picture didn’t come out worth a shit. Going L to R the values for P/E are :
227 (2002), 57.5, 50.5, 38.8, 30.8, 43.5, 15.8, 20.5, 18.0, 11.5(2011), 11.5 (TTM)
The main thing we want to accomplish is determine a typical P/E ratio for AAPL. Since this goes back 10 years we run the full gambit of expensive as hell to pretty damn cheap. Some people will take 5 years, some will take 3 years, whatever. Do you average it or take the median? There is no right or wrong answer here but you want to be in the ballpark.
For fun let’s say our P/E ratio is going to be 16x. That’s a round-about average from 2008 through 2011. It’s probably high, but this is not an exact science. Besides who’s to say the multiple won’t start expanding again? My crystal ball isn’t as clear as some others.
Now we need one last piece of information; the historical net margin. On the same P/E ratio page back towards the top just under the company name you will see a tab labeled ‘Key Ratios’ (hint, it’s two tabs to the left of our current location ‘Valuation’). Click on that.
For this one we want to scroll down towards the bottom until we find the ‘Profitability’ section.
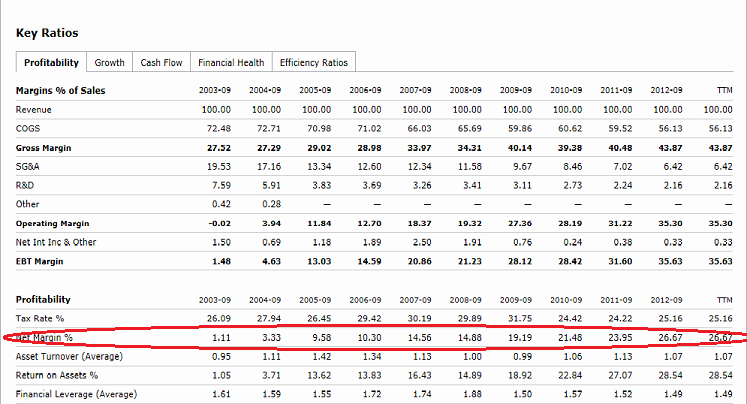
This will give us past net margins for AAPL. Just like with the P/E ratio we want to ballpark this thing. But we have some more leeway here. Are margins trending up / down over the last few years? In this case it does appear that net margins are steadily climbing. If so do we think that trend will continue? I guess so, but maybe you have a different idea. Up to you. For the sake of argument I’m going to use an estimated net margin of 28%. It’s up from Sept 2012 but not drastically.
Now we have all the pieces. All that’s left is some plug and chug. The equations we will use are:
EPS = (Revenue * Net Margin) / Shares Outstanding
Target Price = EPS * P/E Ratio
So in this example we get:
EPS = ($191.62B * 0.28) / 940.69M
EPS = $57.04
Target Price = $57.04 * 16x
Target Price = $913
That’s pretty damn high compared to where the stock is trading now. Does this mean go out and load up on AAPL and come back in a year to gather your winnings? No, but it does mean if you were considering buying the stock now you have a good reason to dig further into the details. No shit… it’s $AAPL we’re talking about; but you get the point.
You can also use this basic framework to come up with different scenarios. Go back to the Yahoo estimates page and plug in the low revenue estimate. If you do that then you probably want to go with a very low P/E ratio since this means they’re missing guidance. Multiple compression will be the result. For example the low revenue estimate is $178.05B. Let’s also keep the margin around 26% and set the P/E ratio at a record low 9x.
Our new price target is (drumroll)…
EPS = ($178.05B * 0.26) / 940.69
EPS = $49.21
Price = $49.21 * 9x
Price = $443
This should be almost a worst-case scenario with the information we have available right now. With the stock trading around $525 today our Risk / Reward is $82 worth of downside to $388 potential upside; or a 4.7x reward ratio. Not shabby.
Disclaimers
I would never use this basic method by itself to take a position. But it can be used to get a quick feel to decide if you want to expend time and resources pursuing an idea. If the stock is close to your estimated value already then you may have better ideas to look at.
This strategy should give a rough estimate of what a company is worth; but don’t apply it to financial or natural resource companies. They have their own rules that make this overly-simplified exercise worthless. Not saying this technique is worth a whole lot to begin with but it’s not applicable at all to banks, miners, E&P, etc.
Stay Paid
Stay Paid
Test
Can still post?
NES Revisited – Harper Strokes Out
Someone with a modicum of class would probably let this week’s update from NES slide since there is nothing to gain from rejoicing in the pain of others. I am not that someone. There was too much shittiness in that update to let it go without chiming in.
Let’s dissect the 8K point by point:
Nuverra expects to report revenues for the second quarter of approximately $165.5 million and adjusted EBITDA2 in the range of $32.8 million to $33.6 million.
Well, that’s a straight kick in the gonads. A 3.7% sequential revenue growth rate does not exactly make for a “high growth” stock. Taking the midpoint of their bullshit “adjusted EBITDA” range provides an EBITDA margin of 20%. This is the same company that claimed they could maintain 30 – 40% margins while rapidly growing revenues.
They were gracious enough to provide a reconciliation between normal EBITDA and their trumped up version of a non-GAAP measure. Regular old EBITDA is projected to be a pissy $23.4 mln again using midpoint figures. That’s a smoooooth 14% EBITDA margin. Yours truly in The PPT projected their margins would come down to the 20 – 15% range. Recognize.
The Company expects cash capital expenditures during the quarter to be approximately $8.2 million
Nice. CAPEX through 2Q this year is slightly higher than last year despite the company carrying 2.6x the amount of assets now compared to last year. Don’t give me that shit about growth CAPEX vs. maintenance CAPEX. The company is in bad shape; pure and simple.
Activity levels in the Shale Solutions segment lagged the Company’s internal forecast, as customers increased activity at a slower pace than originally anticipated, pushing revenue into the second half of 2013 and 2014.
Translated: The growth ain’t there kids.
Unusually harsh weather conditions in the Bakken Shale area, the Company’s largest region of operations, adversely impacted customer completion activity, as high levels of snow and rain hampered vehicle access to roads.
Diversification… get some. Let me give you a free heads up; it’s going to be cold in North Dakota next winter, the winter after that, the one after that, etc. It also tends to rain a little bit up there this time of year.
Operational issues in the Eagle Ford Shale area, a key 2013 growth area for the Company, caused business operations to decline sequentially. Nuverra has taken measures to remedy the situation by bringing in a new management team with significant industry experience and restructuring operations in the region.
This one RIGHT HERE is the red flag of all red flags. We’re talking the Kremlin on May Day back in the 60’s kind of red flags.
When you compete in a highly competitive business, you get one shot and one shot only. NES has already blown their chance. They touted the additions of a couple of former HAL managers earlier this quarter making it sound like they poached the guys. Wrong. Neither one of those guys has worked for HAL in three years. One guy left HAL around 2005.
They can talk about making the management changes until they’re blue in the face but it won’t mean a damn thing until the next 20 companies screw up. If you lose a job due to lack of performance you’re relegated to the back of the queue. That’s how this business works no matter what someone with a cool ass Public Relations degree will tell you. BTW, nice couch, brah.
Stronger than anticipated customer demand in the Marcellus/Utica Shale area led to an increased utilization of subcontractors, resulting in lower overall margins.
So much for that management dream team, I guess. Good management can properly you know… manage their growth. These guys look clueless.
The Company also recently completed an acquisition in the Utica Shale area to expand operations and build on its existing presence in a basin that is very strategic to the Company’s growth plans.
Wonder if this was done prior to quarter end or after June 30? If it was done during 2Q then the $165.5 mln in revenue is even more craptastic than originally thought.
In the Industrial Solutions segment, higher collection and rail logistics costs coupled with stagnant demand in asphalt markets compressed margins and resulted in lower than anticipated financial results.
This is the segment that is supposed to provide a buffer against the cyclical nature of the oil and gas portion of the business. Looks like it’s not performing up to snuff either. Big shock.
Let’s wrap this up by talking a little bit about the deal they recently inked with HAL. This deal is being touted by all sorts of message board peeps as a game changer. It’s revolutionary in nature and will be the catalyst to send NES shares to da moon. Three words… Bull. Fucking. Shit.
No financial terms were disclosed, and it was quite apparent from the press release that NES will be handling the trucking and storing of fluids. That’s not where the money gets made in this kind of deal. Whoever is processing the water, supplying the treatment chemicals and other services will make the bones. Based on nothing more than how the press release was worded I have to believe HAL is the one doing all that.
Conclusion: Avoid this stock. I would not recommend a short position because thinly traded stocks that get pumped on Seekingalpha can burn your ass. But this company is shaping up to be the quintessential value trap. If you think it’s going to be a long term 10 bagger, you’re going to be sorely disappointed.
[youtube:http://www.youtube.com/watch?v=PqKq_kGEtkU 450 300]
A little something about NES
Before you throw money at former Cramer favorite and Seeking Alpha pump and dump promotion, NES, consider this:
1) The company went out and paid top dollar for a Bakken region water disposal company. As a result the company was able to throw out the words “Bakken”, “shale oil”, “energy independent” blah blah blah in their future press releases. The timing of this acquisition sucked balls as they made the purchase pretty much at the very peak of Bakken activity.
2) Other companies have mentioned moving assets out of the Bakken because margins are getting hit left, right and center. Just like usual, when the oilfield finds a good thing they will grind it into sawdust and ruin it for everyone.
3) The company took on a shit ton of debt to make the acquisition. Debt went from $144 mln at the end of 2011 to $566 mln at the end of 2012. Current total debt is roughly in line with YE 2012 figures.
4) As a result of the debt increase, interest expense soared from $4 mln to $27 mln over the last year.
5) The vast majority of the company’s (cough cough) “earnings” come from huge tax benefits. For example in 2012 NES reported $2.5 mln in net income, but they received a smooooooth $58.6 mln tax benefit. Someone is not eating their peas.
6) Remember how I pointed out they made a big acquisiton? Well as a result of said transaction depreciation went up as expected from $21.4 mln to $42 mln. No problem there. The problem is that at the same time they drastically cut CAPEX. CAPEX dropped from $151 mln to $46 mln. If CAPEX doesn’t pick up to replace aging assets then this is a covert liquidation in process.
7) Lastly, they want to be known as an environmental company because those types of companies command higher multiples. They even went and changed the company name to some bad ass sounding, new age, hippified bullshit moniker. Still the same water hauling shit heap as before but now they got a cool name. Unfortunately for them, the market is on to this fucktardedness.
8) There’s a more than slight chance they are cooking their books. Behold the Beneish Earnings Manipulation Model results for NES:
If you’re wondering what the hell a Beneish Earnings Manipulation Model is, google it. It’s not a sure fire way to predict financial chicanery but it does raise eyebrows when you get a score such as the above.
9) There’s a decent enough chance they will go bankrupt based on their Altman-Z score (again, google it if you don’t know what it is):
Po Pimp Capital has a “Chickenhead” rating on shares of NES. I would probably buy shares in WFT before this dung heap.
[youtube:http://www.youtube.com/watch?v=X0pUwmoliEo 450 300]
SLB goes Countrywide, bitches
The hell?
One of SLB’s core precepts is was it would not take equity stakes in clients’ reserves. The old guard at SLB thought it might be a bad idea to compete against their customers. Novel thought, right? Well the new crew led by one-year CEO Paal Kibsgaard decided those OGs didn’t know what the fuck they were doing. I don’t know if this has anything to do with the resignation of the former COO two weeks ago or not, but the timing is suspicious.
Apparently Paal and his crew rolled up to FST and offered them a drilling carry on some of their Eagle Ford acreage. Since this was such a complete 180 from previous company policy it was brought up in last month’s earnings call. Paal said it was the only way to make the deal work so they went with it; but they won’t do it again (ha ha ha ha ha). In other words, FST didn’t have the cash to pay for SLB’s services but SLB was hell bent on doing the deal. Hmmmmmmm.
Now we shift focus to what is going on down in Venezuela. Last Q all the big service companies suffered impairments due to the devaluation of Venezuela’s currency. Shit happens, this is not a big surprise. It’s not the first time it’s happened nor will it be the last. Call it a cost of business for working down there.
No, the interesting part comes from yesterday’s announcement (http://on.wsj.com/10ZABHN) that SLB has extended PDVSA (the Venezuela state run oil company) a $1 billion revolving credit facility. Are you fucking shitting me? Companies aren’t sure they are going to get paid by these deadbeats and Paal decides to float a $1 billion revolver their way.
Has SLB become the sub-prime lender in the oil patch?
[youtube:http://www.youtube.com/watch?v=SKfTTGnWnKA 450 300]
Quick and Dirty Valuation Example
So you want to do a quick valuation?
No, this article is not going to have you competing against Wharton MBA’s or anything but sometimes you just need quick and dirty. Maybe you have a kegger to attend and don’t have time to build a full-scale financial model. The premise we will use is a multiple analysis. I’ll use $AAPL as an example because everyone and their dog has an opinion about it. There’ s not much if any hidden value or traps lurking out there. If you know the first thing about valuations already, feel free to skip this. You won’t learn anything new.
The idea is that over time a company is going to ebb and flow but revert back to some average performance levels. In order to get started we’re going to need a few pieces of important data. The main things we’re interested in are revenue estimates for the next year, shares outstanding, historical margins, and typical P/E ratios.
Everyone likes to rag on Yahoo! Finance and that’s fine. But not everyone has access to a Bloomberg terminal or FactSet consensus numbers. For our purposes Yahoo will suffice.
First step is to go to the “Key Statistics” for $AAPL and get the shares outstanding. You’ll find them on the right hand side about half way down the page.
Shares outstanding is 940.69M.
Now we want the revenue estimate for 2013. Go to the “Analysts Estimates” link on the stock in question ($AAPL)
After that, look in the second box for revenue estimates. Find the estimate for 2013. In this case it’s $191.62B. Alright that was easy enough. Now what about that other bullshit like historical margins and P/E ratios?
We’re in luck as we can use some more free stuff from Morningstar for this part of the puzzle. Go to:
http://financials.morningstar.com/valuation/price-ratio.html?t=AAPL®ion=USA&culture=en-us
If you’re doing a different company then change AAPL in the above link to your symbol of choice. If you think you might be doing this a few times go ahead and save a bookmark so you can get back here easy enough. For other stocks you can either change the symbol in the link or put it in the ‘Quote’ box up at the top of the page.
What we want to do on this page is scroll about halfway down to the “Valuation History” section. Under the bar charts you’ll see “Price/Earnings”
Apologies, but that picture didn’t come out worth a shit. Going L to R the values for P/E are :
227 (2002), 57.5, 50.5, 38.8, 30.8, 43.5, 15.8, 20.5, 18.0, 11.5(2011), 11.5 (TTM)
The main thing we want to accomplish is determine a typical P/E ratio for AAPL. Since this goes back 10 years we run the full gambit of expensive as hell to pretty damn cheap. Some people will take 5 years, some will take 3 years, whatever. Do you average it or take the median? There is no right or wrong answer here but you want to be in the ballpark.
For fun let’s say our P/E ratio is going to be 16x. That’s a round-about average from 2008 through 2011. It’s probably high, but this is not an exact science. Besides who’s to say the multiple won’t start expanding again? My crystal ball isn’t as clear as some others.
Now we need one last piece of information; the historical net margin. On the same P/E ratio page back towards the top just under the company name you will see a tab labeled ‘Key Ratios’ (hint, it’s two tabs to the left of our current location ‘Valuation’). Click on that.
For this one we want to scroll down towards the bottom until we find the ‘Profitability’ section.
This will give us past net margins for AAPL. Just like with the P/E ratio we want to ballpark this thing. But we have some more leeway here. Are margins trending up / down over the last few years? In this case it does appear that net margins are steadily climbing. If so do we think that trend will continue? I guess so, but maybe you have a different idea. Up to you. For the sake of argument I’m going to use an estimated net margin of 28%. It’s up from Sept 2012 but not drastically.
Now we have all the pieces. All that’s left is some plug and chug. The equations we will use are:
EPS = (Revenue * Net Margin) / Shares Outstanding
Target Price = EPS * P/E Ratio
So in this example we get:
EPS = ($191.62B * 0.28) / 940.69M
EPS = $57.04
Target Price = $57.04 * 16x
Target Price = $913
That’s pretty damn high compared to where the stock is trading now. Does this mean go out and load up on AAPL and come back in a year to gather your winnings? No, but it does mean if you were considering buying the stock now you have a good reason to dig further into the details. No shit… it’s $AAPL we’re talking about; but you get the point.
You can also use this basic framework to come up with different scenarios. Go back to the Yahoo estimates page and plug in the low revenue estimate. If you do that then you probably want to go with a very low P/E ratio since this means they’re missing guidance. Multiple compression will be the result. For example the low revenue estimate is $178.05B. Let’s also keep the margin around 26% and set the P/E ratio at a record low 9x.
Our new price target is (drumroll)…
EPS = ($178.05B * 0.26) / 940.69
EPS = $49.21
Price = $49.21 * 9x
Price = $443
This should be almost a worst-case scenario with the information we have available right now. With the stock trading around $525 today our Risk / Reward is $82 worth of downside to $388 potential upside; or a 4.7x reward ratio. Not shabby.
Disclaimers
I would never use this basic method by itself to take a position. But it can be used to get a quick feel to decide if you want to expend time and resources pursuing an idea. If the stock is close to your estimated value already then you may have better ideas to look at.
This strategy should give a rough estimate of what a company is worth; but don’t apply it to financial or natural resource companies. They have their own rules that make this overly-simplified exercise worthless. Not saying this technique is worth a whole lot to begin with but it’s not applicable at all to banks, miners, E&P, etc.
