
So you want to do a quick valuation?
No, this article is not going to have you competing against Wharton MBA’s or anything but sometimes you just need quick and dirty. Maybe you have a kegger to attend and don’t have time to build a full-scale financial model. The premise we will use is a multiple analysis. I’ll use $AAPL as an example because everyone and their dog has an opinion about it. There’ s not much if any hidden value or traps lurking out there. If you know the first thing about valuations already, feel free to skip this. You won’t learn anything new.
The idea is that over time a company is going to ebb and flow but revert back to some average performance levels. In order to get started we’re going to need a few pieces of important data. The main things we’re interested in are revenue estimates for the next year, shares outstanding, historical margins, and typical P/E ratios.
Everyone likes to rag on Yahoo! Finance and that’s fine. But not everyone has access to a Bloomberg terminal or FactSet consensus numbers. For our purposes Yahoo will suffice.
First step is to go to the “Key Statistics” for $AAPL and get the shares outstanding. You’ll find them on the right hand side about half way down the page.
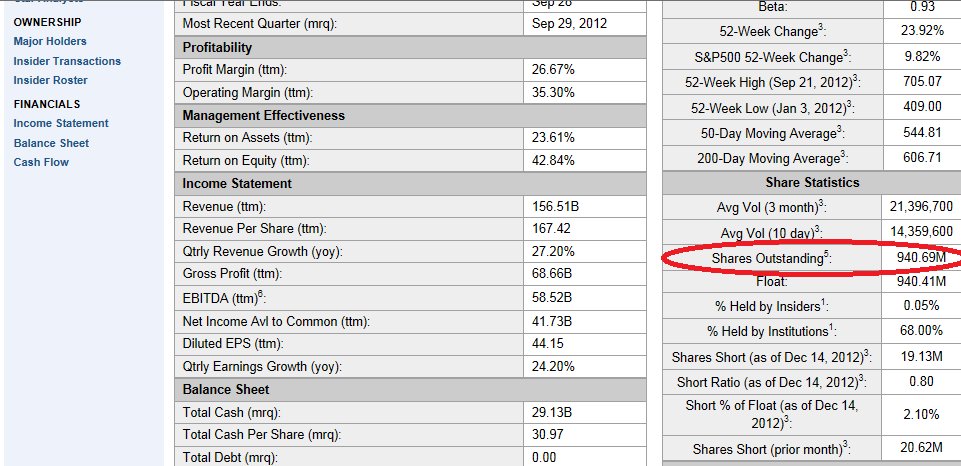
Shares outstanding is 940.69M.
Now we want the revenue estimate for 2013. Go to the “Analysts Estimates” link on the stock in question ($AAPL)
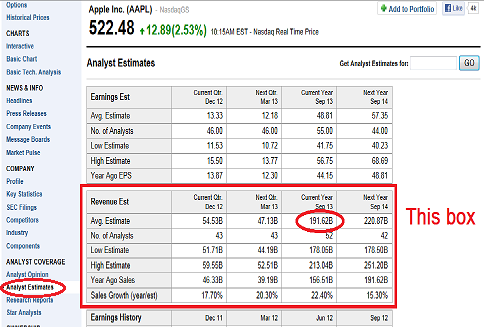
After that, look in the second box for revenue estimates. Find the estimate for 2013. In this case it’s $191.62B. Alright that was easy enough. Now what about that other bullshit like historical margins and P/E ratios?
We’re in luck as we can use some more free stuff from Morningstar for this part of the puzzle. Go to:
http://financials.morningstar.com/valuation/price-ratio.html?t=AAPL®ion=USA&culture=en-us
If you’re doing a different company then change AAPL in the above link to your symbol of choice. If you think you might be doing this a few times go ahead and save a bookmark so you can get back here easy enough. For other stocks you can either change the symbol in the link or put it in the ‘Quote’ box up at the top of the page.
What we want to do on this page is scroll about halfway down to the “Valuation History” section. Under the bar charts you’ll see “Price/Earnings”
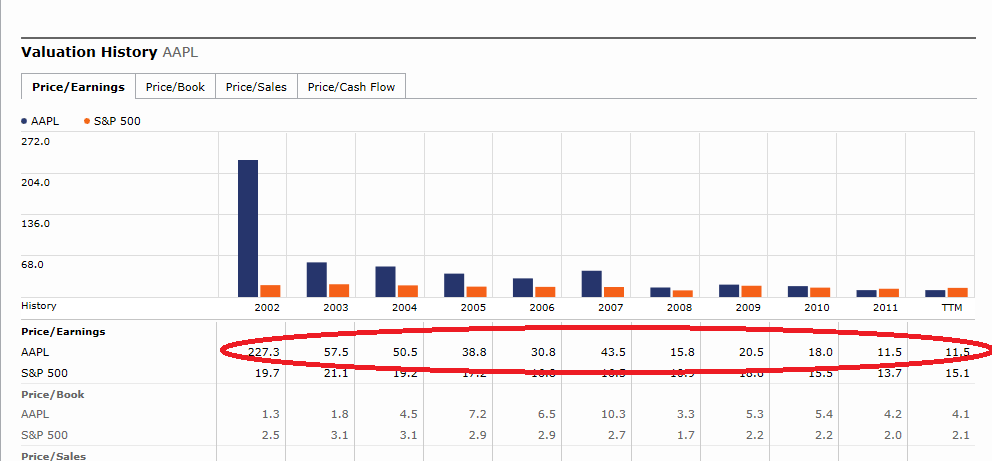
Apologies, but that picture didn’t come out worth a shit. Going L to R the values for P/E are :
227 (2002), 57.5, 50.5, 38.8, 30.8, 43.5, 15.8, 20.5, 18.0, 11.5(2011), 11.5 (TTM)
The main thing we want to accomplish is determine a typical P/E ratio for AAPL. Since this goes back 10 years we run the full gambit of expensive as hell to pretty damn cheap. Some people will take 5 years, some will take 3 years, whatever. Do you average it or take the median? There is no right or wrong answer here but you want to be in the ballpark.
For fun let’s say our P/E ratio is going to be 16x. That’s a round-about average from 2008 through 2011. It’s probably high, but this is not an exact science. Besides who’s to say the multiple won’t start expanding again? My crystal ball isn’t as clear as some others.
Now we need one last piece of information; the historical net margin. On the same P/E ratio page back towards the top just under the company name you will see a tab labeled ‘Key Ratios’ (hint, it’s two tabs to the left of our current location ‘Valuation’). Click on that.
For this one we want to scroll down towards the bottom until we find the ‘Profitability’ section.
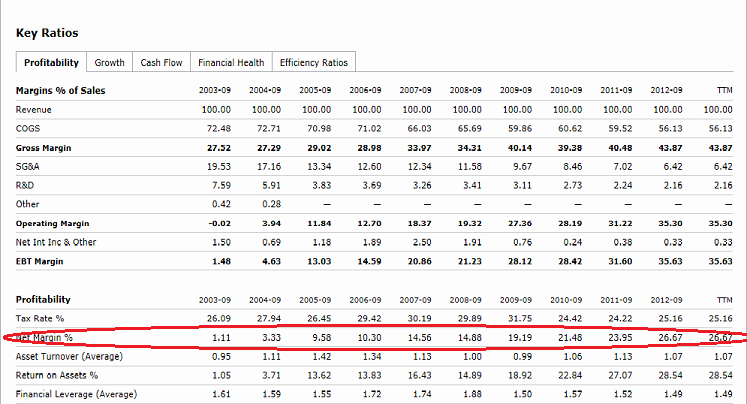
This will give us past net margins for AAPL. Just like with the P/E ratio we want to ballpark this thing. But we have some more leeway here. Are margins trending up / down over the last few years? In this case it does appear that net margins are steadily climbing. If so do we think that trend will continue? I guess so, but maybe you have a different idea. Up to you. For the sake of argument I’m going to use an estimated net margin of 28%. It’s up from Sept 2012 but not drastically.
Now we have all the pieces. All that’s left is some plug and chug. The equations we will use are:
EPS = (Revenue * Net Margin) / Shares Outstanding
Target Price = EPS * P/E Ratio
So in this example we get:
EPS = ($191.62B * 0.28) / 940.69M
EPS = $57.04
Target Price = $57.04 * 16x
Target Price = $913
That’s pretty damn high compared to where the stock is trading now. Does this mean go out and load up on AAPL and come back in a year to gather your winnings? No, but it does mean if you were considering buying the stock now you have a good reason to dig further into the details. No shit… it’s $AAPL we’re talking about; but you get the point.
You can also use this basic framework to come up with different scenarios. Go back to the Yahoo estimates page and plug in the low revenue estimate. If you do that then you probably want to go with a very low P/E ratio since this means they’re missing guidance. Multiple compression will be the result. For example the low revenue estimate is $178.05B. Let’s also keep the margin around 26% and set the P/E ratio at a record low 9x.
Our new price target is (drumroll)…
EPS = ($178.05B * 0.26) / 940.69
EPS = $49.21
Price = $49.21 * 9x
Price = $443
This should be almost a worst-case scenario with the information we have available right now. With the stock trading around $525 today our Risk / Reward is $82 worth of downside to $388 potential upside; or a 4.7x reward ratio. Not shabby.
Disclaimers
I would never use this basic method by itself to take a position. But it can be used to get a quick feel to decide if you want to expend time and resources pursuing an idea. If the stock is close to your estimated value already then you may have better ideas to look at.
This strategy should give a rough estimate of what a company is worth; but don’t apply it to financial or natural resource companies. They have their own rules that make this overly-simplified exercise worthless. Not saying this technique is worth a whole lot to begin with but it’s not applicable at all to banks, miners, E&P, etc.

