Another day another gap higher as investors celebrate the world not blowing up last night with a decent rally.
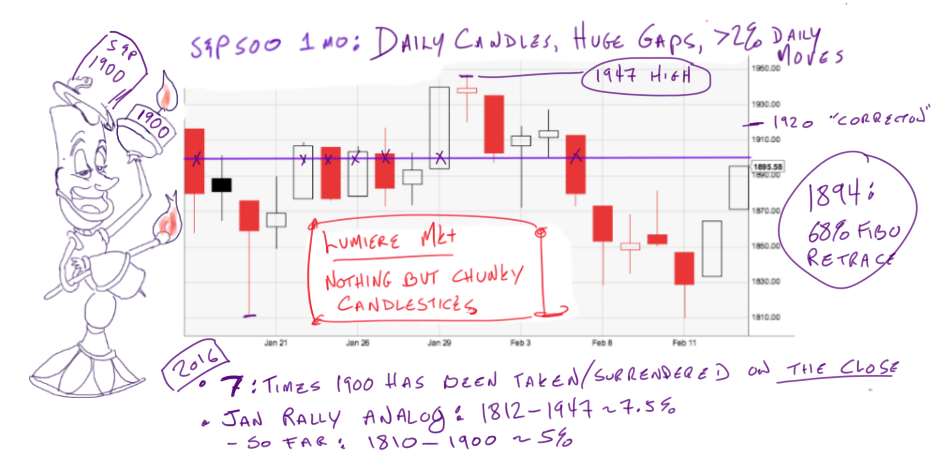
As of the open this morning the S&P 500 had tacked on a cool 85pts since the lows from last Thursday. The high on February 1st was 1947. Yesterday’s close at 1894 marked a perfect 62% retracement of 147pt 6-day loss.
Which is sort of cool but probably won’t prove critical. More concerning are the crazy trading ranges that have been happening for the last month. Today could be the 14th time intraday and 8th time the 1900 level has been taken by the forces of good or evil.
The idea of endlessly taking on and off S&P500 1900 hats and all the fat candles over the last month got me thinking of Lumiere, the hyper-sexual candle in Beauty and the Best.
I’m sure I’m not alone on that…
It’s not normal for the S&P 500 to move 2% a day. Not remotely. Here (via Bespoke) is average daily market data from the 2009 lows to 2012.
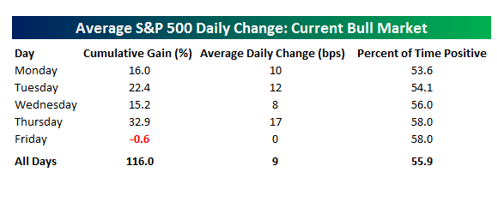
During this relatively benign but not uneventful period stocks changed about 9-basis points, or .9% a day.
Here’s what it looks like now:
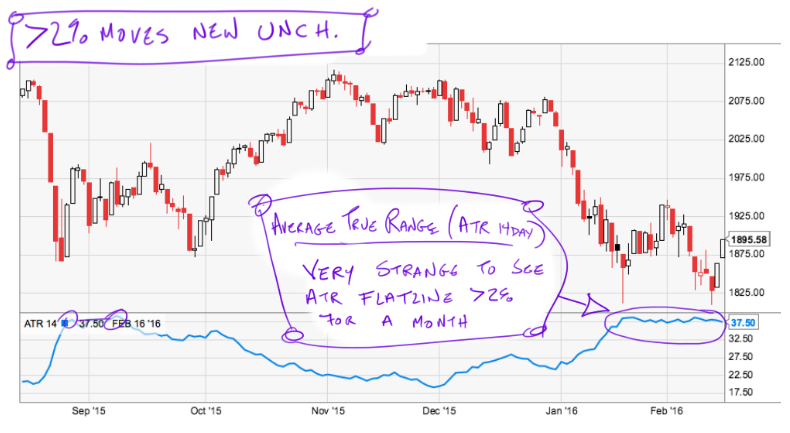
The ATR is the the 14 day moving average change of stocks. It’s true volatility in the price of stocks. Right now the ATR is 37.5 or about 2% (37.5pts = 1.98% if the S&P 500 is 1895). That’s more than double the long-term average. It’s not a historically high level but it is elevated.
What has me obsessing about this wonky measure is that this is the longest I’ve ever seen a market grind and reverse with such weird consistency. Stocks have gone nowhere for a month but they’ve done by moving 2% a day.
That’s weird. I tend to think it’s bullish (weak hands getting flushed) but it certainly represents a turnover in the nature of people holding stock. Presumably we have stronger hands in stocks than we did a month ago. If oil drops to $10 tomorrow that won’t matter at all but all things being equal it’s good to have braver money long stocks.
When the market gets healthy the ATR will fall immediately. Bull markets take escalators higher then fall down elevator shafts. We’ve spent 20 trading days shaking furiously in place. That’s generally not great but may not be today’s business.
What matters today is that Tuesday’s close is now nice support. 1947 is huge resistance but there’s supply every step of the way. Today feels “reversalish”… like it wants to start higher and roll-over all day. I’m not trading on that feeling as the feeling could just be me not feeling like I’m long enough. Watch the close. More in a bit.
If you enjoy the content at iBankCoin, please follow us on Twitter

Thanks Jeff.
I agree this feels too weird. Textbook would say that 1897 or 1947 is the resistance point but I have a feeling people are just waiting to sell at higher levels.
Not sure where that is & i’m clearly not using any objective reasoning so it’s all just conjecture & i’ll wait this one out.
I’m long ABX and that’s it.