[youtube:http://www.youtube.com/watch?v=0UjsXo9l6I8 450 300]
_______________________________
It’s probably a good thing that I didn’t post last Thursday or Friday, as I don’t think any of my advice would have been either financially profitable or mentally soothing to any of you.
The reason I’d have been no use to you is I would have had you stand still like wooden statues carved by lonely puppeteers looking for companionship and later, kindling. We are all, after all, kindling, and the important point is to make life more affable for those around you, beginning with your family and radiating out to the farthest reaches of humanity and the Animal Kingdoms.
It’s no cliche to admit that it often takes money to achieve such goals, and what we are doing here is trying to help you retain and build your allotted sums, thereby making you a more useful engine — in the full Sodoresque sense — to yourself and your neighbors. In that vein it’s just as important to protect principal in times of decline as it is to maximize returns in times of advantage.
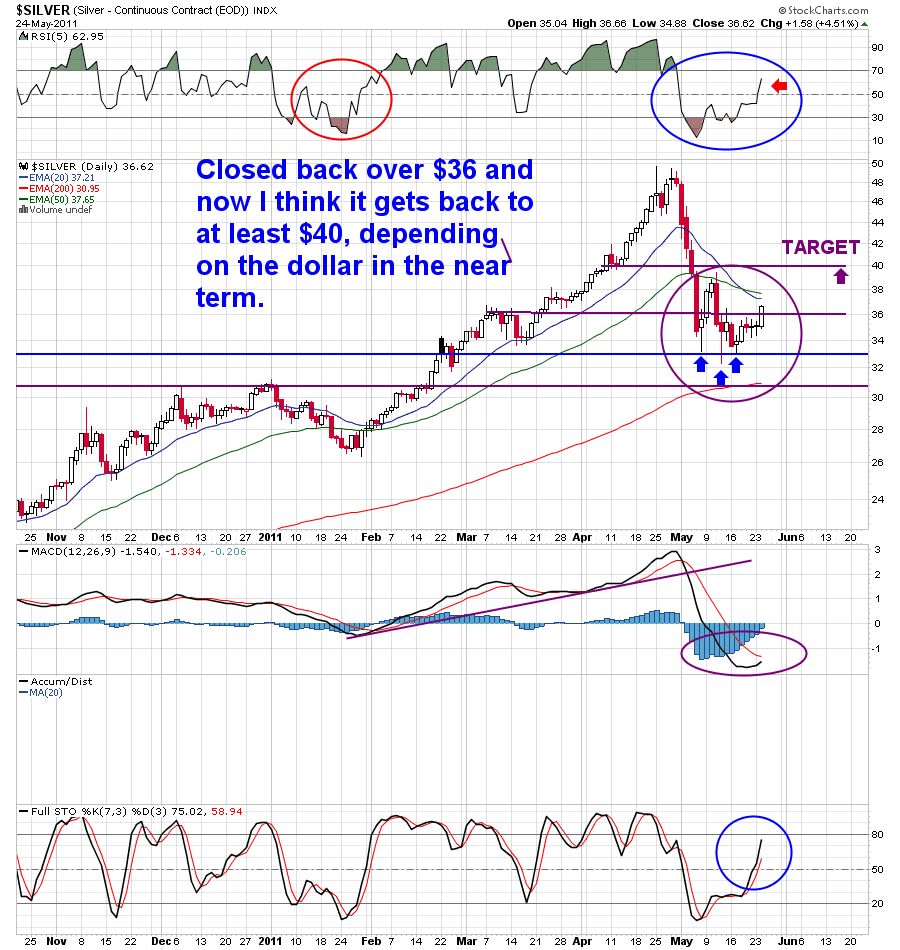
Which brings us to tonight’s — and perhaps this week’s and month’s — most important chart. You’ve seen me put great store in the Amex Gold Bug Index — known as the $HUI (pronounced “Huey” in these parts) — with regard to the state of gold and silver stocks as a whole. I believe this “unhedged” miner index shows us the best state of the gold and silver stock universe, and frankly, I think we are on the razor’s edge at this juncture. Attend to the daily chart:
 As you can see, we are well below the 200-day EMA (almost 7% now) and, more important, we closed just a tad below the long term support line. Given that support lines are not “exact science” and that traders like to use them to scare out tech watchers to collect easy cash, I’m not yet convinced that the above spells “DOOM” in capital letters.
For instance, we toyed with $495 (the real line, in my opinion) all day on Friday and yet closed above it on Friday, despite strength in the dollar. Also, the 5-day RSI (top stochastic) is showing a positive divergence over the last three days.
But let’s not kid ourselves, huh? If we cannot stay above this long term support at $495, the next stop is $475, and quite possibly, $450.
So let’s keep our eyes open, shall we? You should be at anywhere from 25%-50% of your core right now, depending on your risk tolerance, if you are following my long term plan. Therefore, this is either an opportunity to add some for a turn to at least $520 on the $HUI, or to shorten the leash even more for a likely drop the same measure to the negative — at $470-75.
Hang in there, brighter days still remain ahead of us.
________________
Comments »