WEEKEND JOURNAL
Saturday May 14, 2016

(Everything here is opinion, not fact. It is not a recommendation to buy or sell any security. Do your own due diligence; this is mine, I am just sharing.)
Weekly Summary:
- Market gets the oversold bounce we expected as double bottom acquires it’s target.
- Market now setup for further downside.
In my last post here on ibankcoin, at the end of Q1, the market was slowly grinding into it’s double bottom upside target of 2084. We thought there was little reason at that point to think that technical target would not get acquired and it ultimately did. The market ultimately hit it’s highs on 420 (ponder that for a moment).
The landscape has changed. For those of you that don’t follow me daily, you know we are now creating the 3rd consecutive and now much larger topping pattern that has this market setup for further downside.
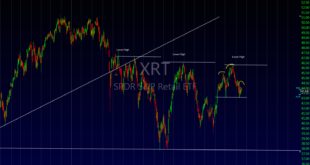
A good time to take profits in what appears to be a major trend change setting up is as soon as CNBC run’s their “Markets in Turmoil” special, which successfully called the last two swing bottoms. They ran the first one on 8/21/2015 and we bottomed on 8/25/2016 (2 days later)
and a 2nd one on 2/9/2016, and we bottomed 2/11/2016 (again 2 days later). Why people watch that garbage is amazing to me. Watch the price action and tune out the noise. I’m sure now all the current focus is when we are going to make new highs. Well not for a while and here is why.
Chart here shows the two CNBC market in turmoil specials.

Coming into the week, we had acquired our initial downside targets on all of the major indexes and regular followers know I said to be ready for the bounce off of those targets to continue as the markets (at least from a stochastics perspective) were oversold.
I posted this chart (1st chart, below) and said “I expect a move back above Monday’s highs, as this will allow the algos to take out all the shorts who have stops up there, and that’s how the game is played“.
On the chart I said. “Gun to my head, algos trigger all stops and take us to 2084-2085” (see 2nd chart below)
If you guys have any doubt now that I have a feel for price action, you might as well stop reading here and go back and watch CNBC, who is actually very good at calling market tops and bottoms, they just have a funny way of presenting it.


The market is in turmoil folks. All major indexes have more or less completed or triggered H&S topping patterns on the hourly charts. And if you are getting the nightly reports, while we watched the potential bullish pattern in the S&P 500 right shoulder, as I was tweeting Friday, taking out Thursday’s low was a major line in the sand, which broke. It does not mean we can’t see some more chop in this 2084 – 2050 area next week, if they decide they want to hold it up through OPEX, but I will be very very comfortable selling any strength now. That will be my plan if they try to hold this up, use strength to build a bigger short position.
THE S&P 500 –
H&S top target is 1967.85 (we will re-evaluate there)
As you know I like to have a place where we might consider ourselves wrong or at least become more neutral. I would start to consider the bearish thesis under attack if we can regain the downtrend, and then last weeks highs.
In order to do that I believe we would begin to see some sort of higher low on the lower time frames to warn us. I see no evidence of that right now. Quite the contrary as the potential bullish pattern we were watching has all but been killed off. So yes, I always go with the price action if it changes (as you know), but zero on the radar right here. That will remain true for the other indexes which will discuss now.

The Russell – Clean topping pattern which triggered, but needs downside follow through to totally confirm. A gap down would be nice. Downside target 1047.07 (re-evaluate there)

DJIA – H&S top (triggered) target 17000.33 ( re-evaluate there)

NASDAQ COMPOSITE – H&S top (triggered) target 4501.00 ( re-evaluate there)

Long Term Picture:
I don’t like the big picture here at all. Last week we made these points.
“Even if you have the view that this is only a trading range
1) we came to within 30 points from the top of the range
2) We have currently made a lower high here in April after making a lower low in Feb
3) Have a very similar topping candle to the one we saw in Early November
4) Have price action setting up for at the very least a 4% move lower
Is this the place you want to be pressing longs? “
This week things have deteriorated even more. We have very clean shorter term topping patterns (as we discussed above) on the lower time frames, suggesting that the additional 3-5% is likely depending on the index. But there is little reason to believe we won’t at least test the Feb lows. Particularly as triggering these new patterns becomes the 3rd bearish pattern in sequence, since we acquired the double bottom target at 2084. Usually if it’s just a minor pullback, the 3rd does not complete or even trigger so if they do, and I see no evidence at this point they won’t and can start the momo trade lower again. Just like we saw in August and Jan.
Here is a look at the SPX weekly. Notice the long wicked candles at the top and bottom of all major swings. Is this the place you want to be pressing longs?

This chart is best articulated on the NASDAQ, we are in a down trend. Lower Highs and Lower Lows is a down trend. Is this the place you want to be pressing longs?

The R2K – Failed right at the 61.8 Fib from Jun 2015 High to Feb 2016 Lows.

a. The 12 Month moving Avg : Holding above it by a thread. But it is still declining.


b. The 10/20 Month Moving Average Crossover :
Ignoring price for a minute put this in perspective using these long term moving averages.


Breadth
Continues to deteriorate. Last week we had 61% of stocks above the 40 DMA. We are now at 52% Middle of the range, oversold is a long way away.

The Bottom Line:
Things continued to deteriorate this week and we have nice side topping patterns in place to watch for trigger or further follow through. This is our number one priority. We want to see if the bears can maintain control or of the bulls can build some sort of reversal right here at support or just below it. There is nothing in the works just yet, but we must keep an open mind just in case. I am short and will remain that way until I see price action evidence to change my mind. There is none yet. As always follow my thoughts intraday and on the nightly report. If you think this will be interesting to others, please do share and have them join my mailing list. Thanks and happy trading.
This Week’s Chart’s in Focus:
Let’s review a few charts that I consider worthy of your attention:
Comparison: The last few days of this week we were watching that inverse H&S pattern in the SPX. I was noting that the R2k did not have that pattern at all and that I thought that the SPX pattern would ultimately fail. It is also something that is common. The one that is freshest in my head is OMER which is showing a major top on the weekly time frame. You notice how it too at one point had a bullish reversal pattern in the right shoulder. This is now back at the neckline and will likely break down. This is just for comparison as it demonstrates how not only do these patterns exist on all time frames, but that we typically like to give the benefit to the bigger pattern at least until the smaller pattern can at the very least trigger. What I was doing this weak was selling strength, knowing that my risk was the breakout of the bullish pattern, which I thought was very unlikely although I would let the market decide. I thought it is something to bring to your attention, as one of my followers found it interesting and helpful when I posted on Friday afternoon. The SPX did ultimately break down and is now sitting on the neckline as we showed at the beginning of the report.

Transports (IYT): This was in our report last week as well. This triggered the double top pattern and the downside target is 127.13. Needs follow through, but a feather in the bear cap.

Yen: After acquiring it’s inverse H&S target at 92.88, it retreated and has now formed and triggered a Cup/Handle setup targeting 106.31. Still in this channel, as long as it stays in that uptrend, not good for equity.

DBA->Agricultural ETF Sitting right on the inverse H&S neckline. I am long this, my stop would be a close below the 200DMA.

AAPL-> If you are short this one, I still think 80 is a good target and place to take profits. That represents the H& measured move as well as the 161.8 fib from the recent up move well documented in these blog posts


Nice write up. A great amount of info to think about.
someone on ibc who can actually read charts
good post
refreshing lack of hyper-bias and calling people trolls. one of the best trading articles ive seen on ibc to date.
Thorough analysis. I agree. Sold all my small and microcap holdings on Friday. The month of May is a busy time for people with school graduations, weddings and the Memorial Day weekend at the end of the month. Who wants to be in stocks anyway?
Investors with brains are in stocks right now.
Day trader schmucks continue to lose large chunks of money.
Good timing, buddy
Just getting to the comments, thanks for the feedback. I do a ton of regular analysis, so check out my site and follow me on Twitter.
Thanks for the feedback. I’ll keep up the good work 🙂
Yes, I have no bias and am currently working on making the bull case after last weeks failed breakdown. It may not play out, but the market ultimately decides.
That’s an awful bitter response, but when markets are this volatile with no direction it is actually the day traders that make money. As they say $STUDY. It is the arrogant know it alls that lose in the end. The market will determine the final direction. This is merely an unbiased analysis of current price action, when it turns more bullish so will the analysis.