A very brief introduction as this is my first post for the Peanut Gallery. I am a technical trader and I Journal like a mad man as it helps me think through my trades. Like many I take a very top down approach to the market and study the price action primarily in the S&P and Russell to gauge the amount of risk I should be taking. Here I will share some of the things (hopefully each week) that catch my eye or that I am paying attention to. I hope you find my contribution useful. Below are my current thoughts on the markets.
WEEKEND JOURNAL NOTES
Sunday April 3, 2016

Another week another month, another quarter and another central banker saves the day. What else can we say? Whenever there is bearish looking price action on the tape, the central planners come in with some sort of dovish talk or bazooka type money printing and the market doesn’t just bounce but causes an epic short squeeze followed by epic FOMO (Fear of Missing Out). Don’t fight the fed the saying goes and this is a perfect example of why. Will this ultimately end badly? Probably, but until we have bearish price action to work with, what else can we do but protect our longs by raising stops and ride it? Especially after one of the most unprecedented quarterly candles any of us have ever seen.

Let’s take a weekly look at the markets staring with the S&P 500.
At this point in time it looks as though the S&P is going to acquire it’s full double bottom target at 2084.30 (calculation shown on chart) as there is barely a glimmer of bearish price action to work with and as we saw Friday, any kind of dip is bought with both fists. Fighting that just seems stupid. Every bit of me wants to short the (insert word here) out of this market, but the opportunity is yet to present itself.
There are a couple of items however, that I think are very important for us to watch this week.
1) The S&P 500 is ~12 points from not only a major technical target (2084.30) but also this descending trendline, which would protect a prior swing high and leave the longer bearish macro picture in place for the forseeable future. This is a huge area up here in my opinion.
2) I am seeing the first signs of bearish divergence between price and momentum. This can last a while so just seeing that is no reason to short, but it is something I like to make note of particularly when in a position of protecting remaining longs in this rally.

3) This breadth indicator which I monitor closely, caught my eye as I see the possibility of a repeating pattern here in the % of stocks above their 40DMA. Not only do we have a massive divergence in the RSI, but we have this little rising flag, which had the same type of price action in the last two major market moves lower. I will be keeping my eyes on this this week.
Is this breadth indicator flashing a warning?

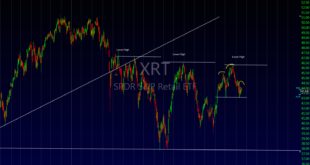
The Russell 2k:
In the Russel many including myself were thinking we were seeing a mini H&S in the Russel last week, which like the one we saw in the S&P was shut down hard by the dovish speech by Yellen.

However on the bigger picture we still have a lower high despite the big rally so it will be interesting to see if the Russel can continue to build on this move or if it is forming a Bearish right shoulder.

The VIX continues to hug this lower Bollinger Band (20,2) as it approaches it’s lowest level since October.

For Long Term Investors:
I like to keep an eye on 2 things.
The 12 Month moving Avg : now flattish, and we are hovering above. I will see if this can prove as support on a pullback.

10/20 Month MA Crossover Watch: The 10 remains below the 20, but price is back above. So using this as an indicator in the way we have been thinking really seems irrelevant now as central bankers continue to hurt any sign of bearish price action.

The Bottom Line:
The S&P 500 is very close to not only acquiring a major upside technical target but also approaching trend resistance with what looks like momentum divergence. Additionally volatility is hovering and continues to press on the lower Bollinger bands near the October lows. One would think that if the bears are going to have any chance things would start to materialize soon. This may mean a month of range like chop like we saw at the end of 2015 before our next big directional move.
Chart’s in Focus:
(XLE): There is no secret that the rally in oil names helped this rally get started and added to it’s strength as it continued. However below both the declining trendline and the declining 200DMA, we are seeing a bearish H&S pattern. Whether this has market implications or not, it certainly has implications for this sector. There are many names in this sector that look extremely vulnerable from my chart reviews so it is worth your time if you are looking for potential short setups.

Biotech (XBI): Has been a complete and utter disaster since last summer but showed some rotation last week. In my mind, this is still a reapeat of what we saw at the end of last year until we can get back above that prior swing high at 54.71 on a closing basis. I become far more interested then.

Apple (AAPL)
I was bullish on AAPL from about 97 and took profits at 105 and have been neutral since. In my mind it (like XLE) is that the 3 lines of bearish defense that I would be very aware of if I were long
1) Descending Trendline
2) Declining 200DMA
3) 61.8 Fib


Welcome
Nice post…great info. 2084 is a magnet.
Enjoyed this post very much.
Very nice . welcome ..
Good work. Will be looking forward to future posts.
Hail HigherLow!!!
nice post man.
Thanks for the info. Most importantly, I have noticed around the web that many others have reached the same conclusions you have. The question then becomes: do long holders sell now or wait? I think they don’t wait. Yen into 110 as I type.
nikkei’s already been getting killed. almost down to feb lows already. -1500 points in less than 2 weeks