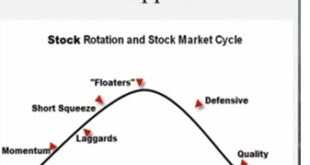
It is a simple question but the answer is very difficult to answer in a way that a computer can understand. Attempting to do so allowed me to learn a lot. When I started the task of trying to put Option Addict’s teaching into code almost a year ago, I wanted to explain it in a way that a computer could understand and assist me in speeding up the process. In doing so I had to put the process under a microscope and learn to think about things in a different way. The only thing all stocks should have in common is the upside should significantly outweigh the downside. However, telling a computer how to determine that isn’t likely. One commonality that I like is contracting volatility. Unfortunately the dataset I am using only has performance and volatility on set intervals such as weekly or monthly so just because price as moved up or sideways from point A to point B as volatility contracted from monthly basis to weekly basis doesn’t mean the setup is good right now. Additionally, what makes a stock worth buying near the highs is totally different than what makes a stock worth buying near the lows.
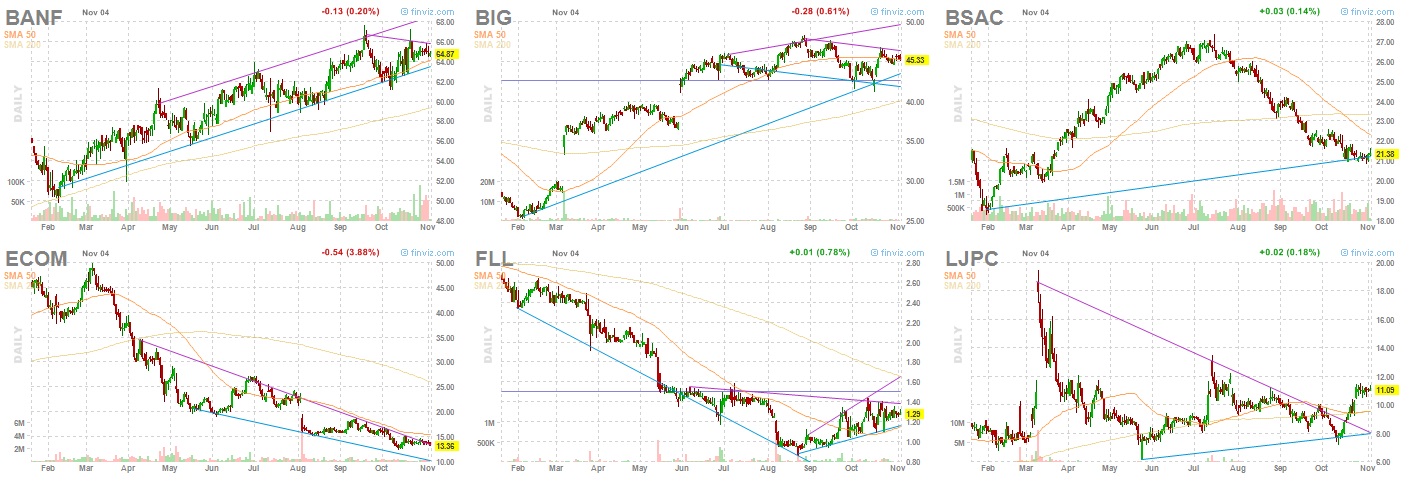
Ultimately a good stock to buy is simply one with asymmetric risk. (a risk/reward ratio that works in your favor). We typically look for a spot where the volatility is contracted severely in a stock and a break one way or another is likely to occur soon. The resolution of that break tends to result in explosive price swings in on direction or another often enough for us to capture big winners. If it goes against us we can salvage premium or sell stock minimizing the loss while letting winners run. There of course is more taught by option addict on how to know what type of stocks to focus on but subscribers of after hours already know that. I chose these 6 stocks among others on 11/4 (see comment in OA’s post 60% in 24 hours) with a lot of help from the “OABOT” which attempts to put much of Option Addict’s teachings into code. I wanted to show these 6 because it is enough to illustrate the drastic difference in a stock’s characteristics near the highs, near the lows, and everywhere between. Each of these stocks were at least in the top 80 of their respective “categories” and were selected out of nearly 7000 different stocks total. Not every stock can be given a rating and not every stock ends up in the right classification and not every stock with the right classification and high rating turns out like you hope. However, by characterizing a few things and breaking the stocks up into groups you can at least treat stocks with certain characteristics differently, and have EACH classification scored individually. Although it is no certainty that a stock with no dramatic moves over past month or week, with contracting volatility and daily move less than 2.5 times the ATR (you want to buy something currently in a tight range relative to the last several days as well as contracting in volatility over the entire week.) That tends to be a very good starting point. Rather than filter OUT all stocks that don’t meet these characteristics points can be awarded IF a stock meets criteria A OR B and you can program the excel spreadsheet using IF (Criteria A) AND (B),OR (C) AND (D) THEN (add X points) type language. But stocks near the low need to see a sign of bottoming and be such that it is starting to curl up and then consolidate where as stocks with strong trends you wait for recent weakness and for it to consolidate without taking out prior lows. In terms of what you tell the program this is drastically different so you must code it such that IF criteria such as percentage off the highs or lows is met THEN classify the stock differently.
For example, a “trash” stock that has been chronically underperforming should ideally see some recent short term strength and be turning the corner on the short term and consolidating upwards off the lows and short term be showing signs of a new uptrend such as a stock not being far below, and ideally being above the 20 day moving average. A laggard stock’s who’s just recently been dumped on the other hand will probably be below the 20 day moving average so that criteria might not even be used. It should either still be in a strong long term uptrend and/or be seeing some sign of selling exhaustion, oversold condition and perhaps some short term consolidation along with it still being up from it’s 52 week low and possibly above the 50 day low so that it is likely to be making prior lows. The laggard was the most difficult stock to classify and rank as it represented almost all of the “leftovers” that were not close enough to highs or institutionally owned enough to be considered “quality or “momentum” but were not so illiquid and chronically underperforming enough to be labeled “trash stocks”. Ultimately I had to break it up into 3 separate categories to be able to apply different scoring metrics while still lumping all 3 of them in the laggard category.
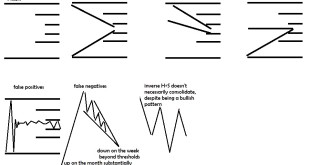
I knew that every stock should be consolidating in some way, however in some cases consolidation could be more of a continuation pattern to the downside where as others it could be reversal pattern from the upside back down. The fact that it is consolidating on it’s own might not be useful. So each metric of consolidation must be first evaluated and scored individually and manually looked at within the context of other evaluation.
I decided to integrate fundamentals at first but in hindsight I wish I would have kept that separate and have separate classifications for fundamental scores as well so that it would be easier to filter out at will. At some point I will probably end up undoing the fundamentals. For example, for “momentum stocks” I had rewarded accelerating earnings growth substantially and as a result it is a lot more difficult to use the ranking to find good technical setups in “momentum stocks” unless they also are showing earnings growth. For “quality stocks” I decided to look at stocks that had plenty of liquidity, and insider and institutional ownership along with positive earnings growth. The problem with that of course is there can be biotech and speculative companies with high quality charts which are still leading their respective industries without positive earnings. There are many challenges faced with classifying stocks. Do you neglect some stocks and have some good stocks that you miss or get miscategorized? Or do you risk grabbing too many stocks including those you don’t really have any interest in. Of course with additional complexity it would be possible to only set up a score relative to the sector or relative to the industry or both. I didn’t involve fundamentals for any other classification as I realized at some point I may want a separate ranking. Plus I didn’t want to have a ton of uncategorized stocks that I couldn’t rank.
If you enjoy the content at iBankCoin, please follow us on Twitter


One comment
Pingback: About The OABOT | Hattery's Monthly Trend Report