I stand to you today to announce that I have used data and simulation to prove myself wrong. Call me a flip flopper if you like, but I view this as a constructive thing as I have chosen to take the most profitable and beneficial path rather than the most comfortable. While some remain attached to certain ideas, I let the data guide my conclusion whenever possible. The human mind is full of biases and often too rigid on our ideas. Be open to examining the assumptions that you take for granted on a daily basis just as testing the assumption that “the world was flat” was a productive one, it is possible you may make significantly greater progress than all of those around you who resist the change in your ideas.
My previous paradigm was guided by this understanding of the relationship of risk:
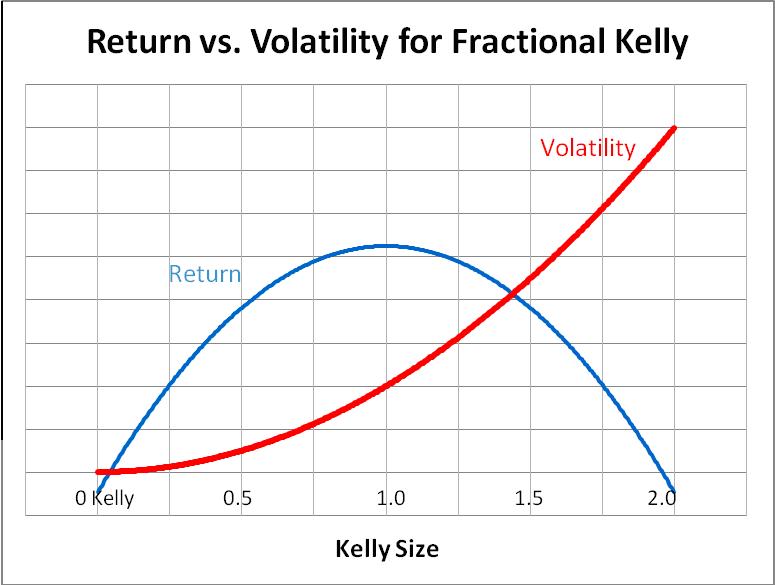
Unfortunately, every model has certain “assumptions” it must make to construct any particular generalized “model”. It is usually not the model itself you should test, but the assumptions within the model, as well as your own personal assumptions which can only be done by data first. After adjusting and testing these assumptions and thinking more dynamically I can see that this is simply not practical as you will also see in a bit.
At first I had a simulator created to calculate all possible permutations of theoretical trades, but realized the simulator could be improved. Rather than continuing down the direction I was headed, I “flip-flopped” again, instead opting for constant improvement. I instead came up with a spreadsheet that uses the random number generator and a “Monte Carlo simulator” plugin that I view as much more efficient and flexible in terms of the duration of trades in which I want to test. Although it lacks the same degree of precision, it is a productive tradeoff as you can still increase precision in exchange for a more timely monte carlo simulation (with more random iterations).
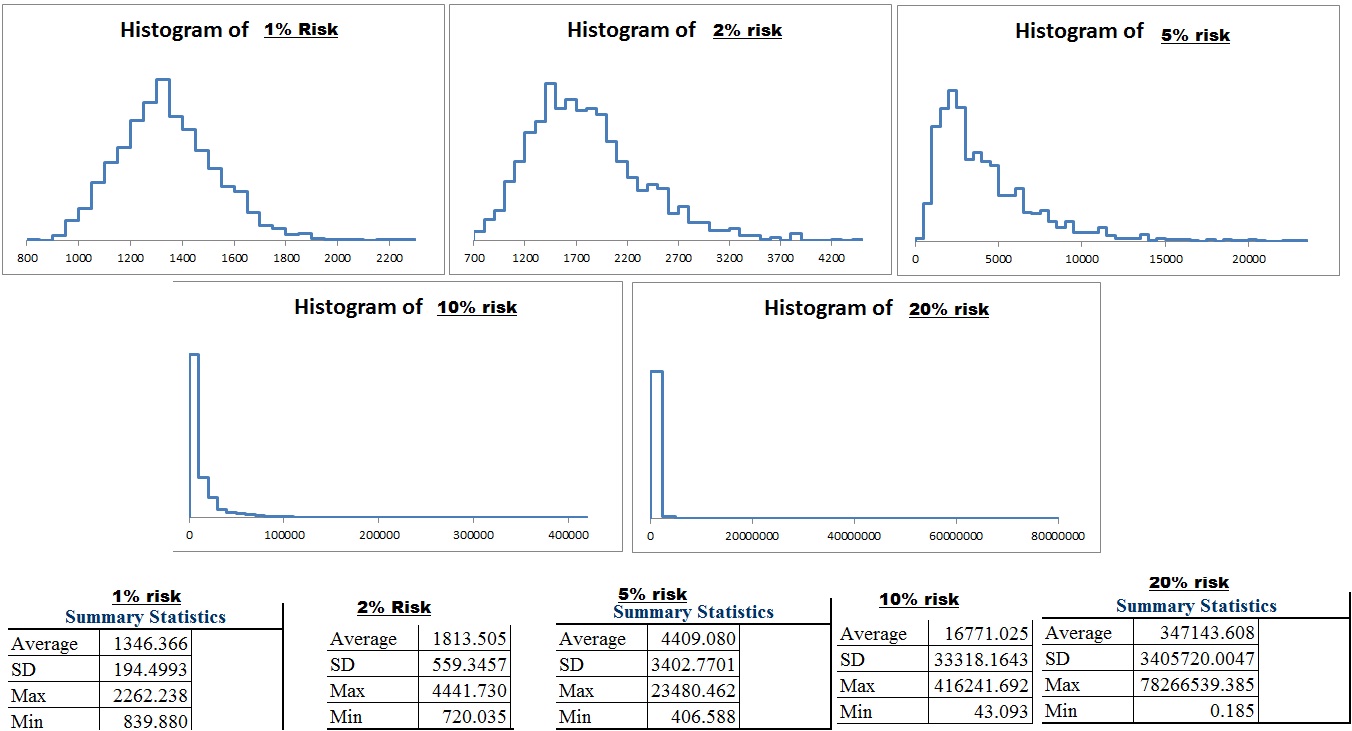
I used the spreadsheet to look at returns dynamically over a finite amount of time such as 300 trades. Out of a thousand traders for example, some percentage may gain 20% while another percentage gains 100% and another percentage loses 50%. Using this data, A histogram plotting all simulated results of each of the thousand random iterations of 300 trades was made for various levels of risk given a particular system. The simulation allows for a change of any one of these inputs (probability of 5 different “results” of the trade, the ROI given each of these 5 “results” the number of traders randomly selected and the number of trades they make). You can even look through random equity curves across all 300 trades at a given risk factor and refresh it with a push of a button to pull up another random trader to get a better sense of drawdown within different points of the system over the course of those 300 trades.
Without further ado, here are some results!
pX=probability of event X.
wX=win % (ROI) given event X.
System: p1-5=20% W1=150% W2=50% w3=0% w4=-50% w5=-100% A winning system is presented.
Risk defined as capital at risk since this is an option strategy and you can lose the entire premium.
“optimal F % / full kelly = 14% risk”
Note the severe skew right. This means as you increase risk extreme outliers begin to skew the average higher than what is “typical”. Skew right means the mean (average) is way higher than the median (average). The “worst case scenario” grows with risk. The probability that you end with a lower than average result (that is not a typo) increases as risk increases risk given a finite amount of time. Eventually the probability of a poor result is so great that as you increase risk the long term geometric return suffers. If you are a true cowboy looking to become an “outlier” and willing to put in the risk, then perhaps that is okay with you, but just know that going beyond the “optimal” amount is destructive as you approach “an infinite number of trades”. Just know the type of CRAZY account volatility you will have to endure, and a large probability that you actually will end down even after 300 trades. That’s almost 6 years at 1 trade a week!
Since I took the time to create this spreadsheet, I can simulate thousands, or if I like, tens of thousands of traders trading anywhere from 1 to 300 trades (or more if I take 5 minutes to set up more) with a given system with a push of the button. I can instantly adjust the expectations of the trading system and see how the results change.
In the next post Titled “Equity Curve of Risk – How Risk Influences Expectations” I show some example equity curve of a particular risk percentages.
Comments »