One of the false positives I’ve been getting is the “rising wedge” pattern. This pattern represents upwards consolidation which is more of a bearish setup. While one can certainly trade this pattern, I want to separate it from the bullish patterns at a minimum.

I also currently don’t want to trade the bull flags just yet, although I want them to be available should I need them.
However, I may wish to trade “high tight flags” so I want to keep these separate.
Both patterns show at some point significant price rises so if I scan for significant price rises over a particular period of time or combination of periods, I may be able to filter some of these out and be left with mostly triangle and falling wedge patterns which is mostly what I want to trade.
If I do trade bull flag patterns, I want to start with the high tight flags.
High tight flags are technically defined as a doubling in price over 3 months or less followed by a consolidation period where it falls less than 20% from the high. These I would consider trading and want to know about them independent of bull flags and rising wedges. While I don’t have a 3 month period, I have a 50 day low and high which I can use to define a stock that is up 80% or more and falling less than 20% PLUS I will also want a 20% higher consolidation rank than the market average at the time to qualify. I set this up for high tight flags.
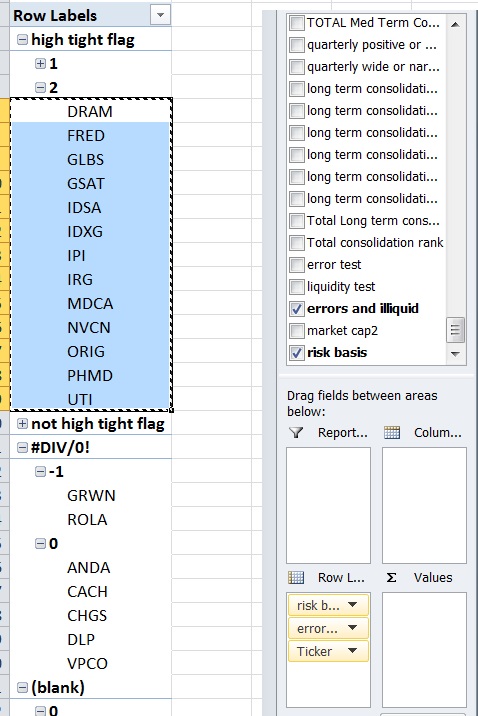
The -1,0 and 1 represent stocks that I omit due to errors or lack of liquidity. While stocks like DRAM and GSAT and PHMD are satisfactory, there are still others that I wouldn’t touch. I could probably bump up the consolidation rank to 30% higher than average to filter some of these, but for now it works.
When done, I should be able to look among those labeled “not high tight flags” and have a separate filter from there to “rising wedges and bull flags” or “remaining stocks” (falling wedges and triangles). This way I can look at the patterns I want and ignore the ones I don’t.
As mentioned before, now I want to work on coming up with a filter for rising wedges and bull flags. The key here is I don’t want falling wedges and triangle patterns showing up as “bull flags and rising wedges”. Even if I have to leave a few rising wedges and bull flags in the remainder, that’s more acceptable to me than having tradable falling wedges be filtered out. I’m okay with keeping bull flags and rising wedges together because it is a challenge to separate them from each other since both consolidate upwards and move from high and low established ranges.
I intend on coming up with a few formulas and changing the details of the formulas to increase the amount of patterns that get filtered until I see a clear falling wedge or triangle show up as a “bull flag and rising wedge” and then tightening the filters so they’re gone. In this case, I probably want to filter out stocks that have no clear pattern but also happen to have been rising since the goal is not to clearly identify rising wedge and bull flags, but instead eliminate stocks from contention from the patterns I am actually looking for.
This should help me narrow down the list and then I can sort that list by consolidation rank and I will be left with triangles and falling wedges that are liquid enough and have the look that I like to trade…
Should I choose to also look through possible rising wedges and bull flags for patterns I can, but the goal is to reduce the number of bad and untradable patterns without removing any trading opportunities. After filtering the high tight flags, the rising wedges and bull flags I want to look for other patterns that I don’t want in the remaining. If I can filter out some bear flags or something that will improve the quality of what I’m looking at.
The perhaps more important reason behind doing this is that I want to know which industries have multiple falling wedges and triangle patterns because these are the industries I want to trade. Of those industries with multiple falling wedges and triangle patterns I want to be able to sort by average consolidation rank of these patterns. Stocks that set up together in a low correlation environment tend to break out together.
While the original OABOT did a pretty good job of compartmentalizing the setups by where relative to the highs and lows they were and adjusting based upon industry, the inability to rapidly split test variations in formulas prevented me from being able to make improvements quickly. THe new OABOT will eventually be much better once I go through every layer I want to.
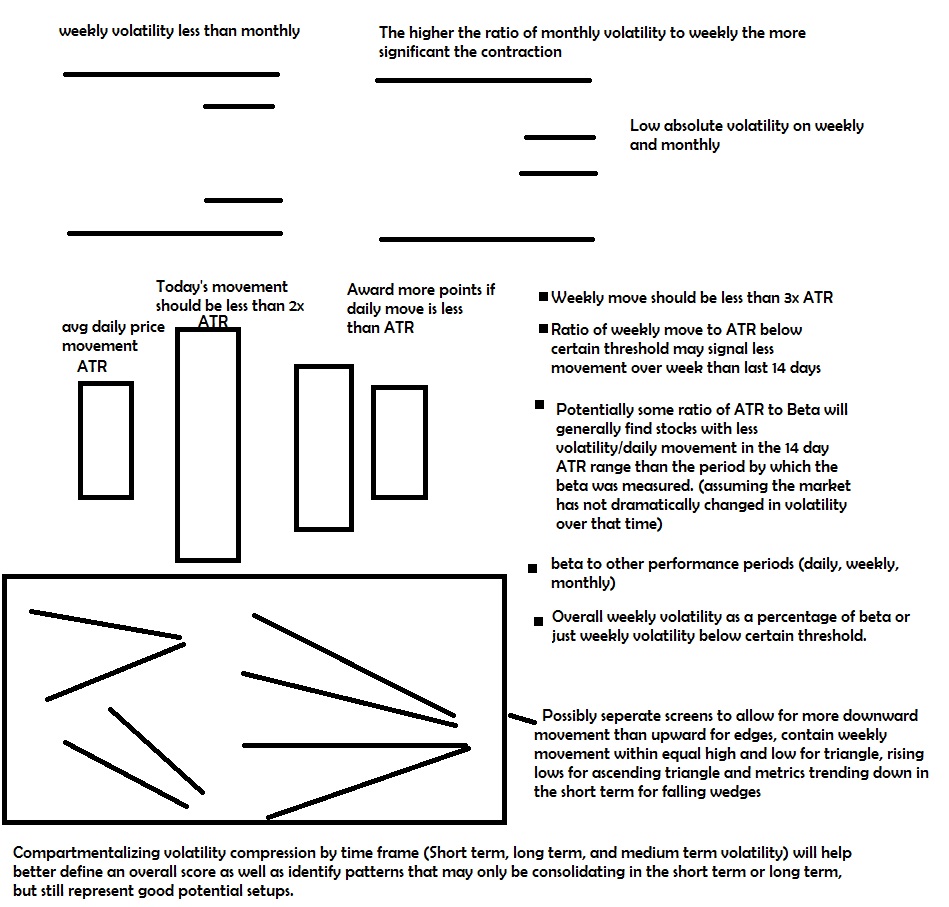
The next step after this will probably be “risk factor” which will attempt to handicap a stocks level of “risk” by looking at beta, ATR, monthly volatility, change (over 1 quarter, 6months and 1year), distance from highs and lows and industry metrics vs the market and the individual stock vs it’s peers in sector, industry, market cap size, exchange or index its trading in and other variables.
I could also look at classifying stocks within 10% of highs, 10-25% below highs, 25%-40% below highs and stocks near lows and run a count by number of stocks in each category and consolidation rank of each of these categories and other variables to help me better understand what is setting up right now.
Comments »