The one problem about using something such as “volume profiles” is that it can be tough to look back on a chart and illustrate what the volume profile looked like “BEFORE” the break to compare it. In other words the volume profile will have changed dramatically since it “filled” the volume pocket. For example, you might notice a similar pattern shaping up and have a small handful of stocks that you think it may have looked like, but you can’t quite remember or even begin to “compare”. You may wish to do a “case study” on volume profiles, or big movers through such profiles. You also may want to look at whether the big moves were an isolated event, or if many chart patterns had similar volume profiles and chart patterns. You also may want to study the daily moves or 30m chart of a setup that happened months ago
Without a time machine, you can’t really study the past. Enter “think or swim on demand”… a “time machine” of sorts.
It is excellent for those who wish to develop more trading experience and revisit periods of time in which perhaps emotions got in the way. It should be much easier to see things objectively, yet relive the trade down tot he minute if you’d like. Built in experience It is excellent for studying stocks that have moved very well in the past to see what the volume profile looked like.
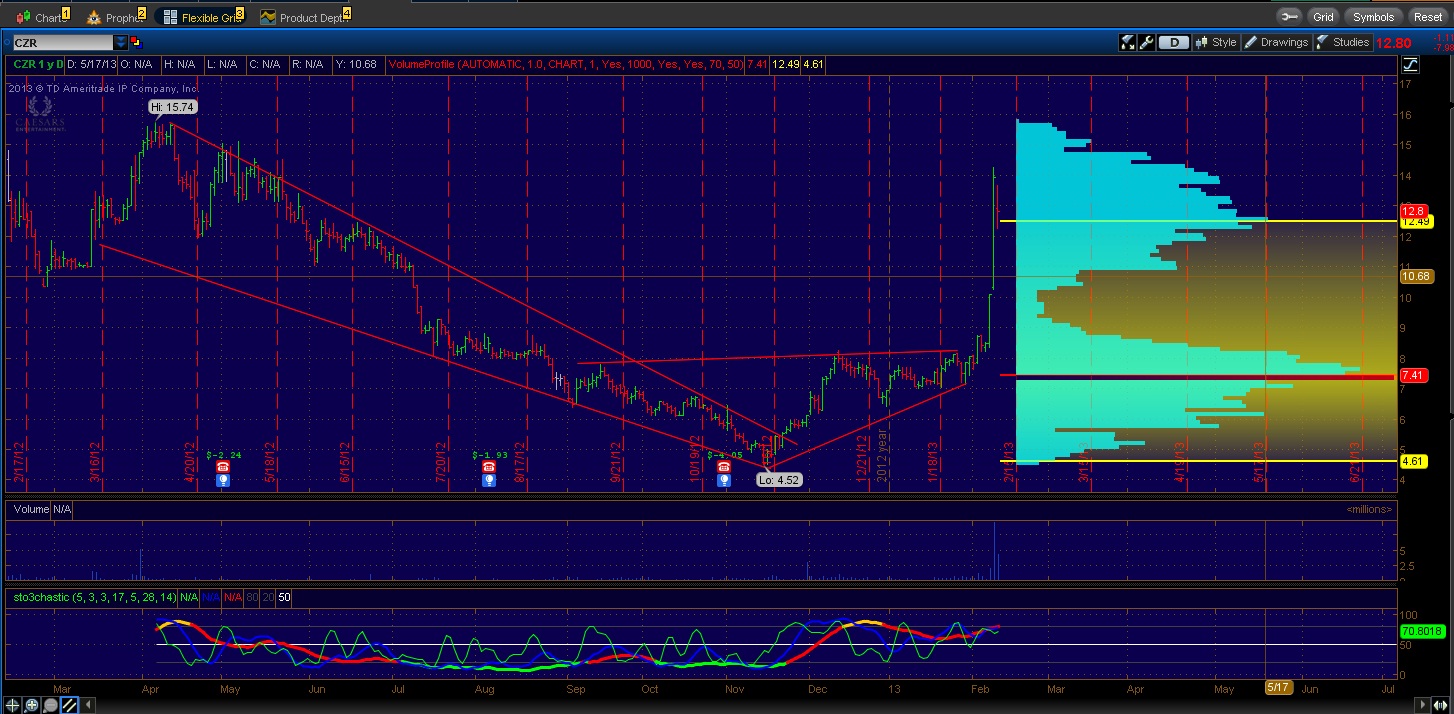
For example, we might look at stocks up over 100% in the last year and come across some names we may want to check out. As of 10/21/2013 this is what CZR looks like.
We can see some big moves and an overall major move from a low of under $5 to a high over 25.
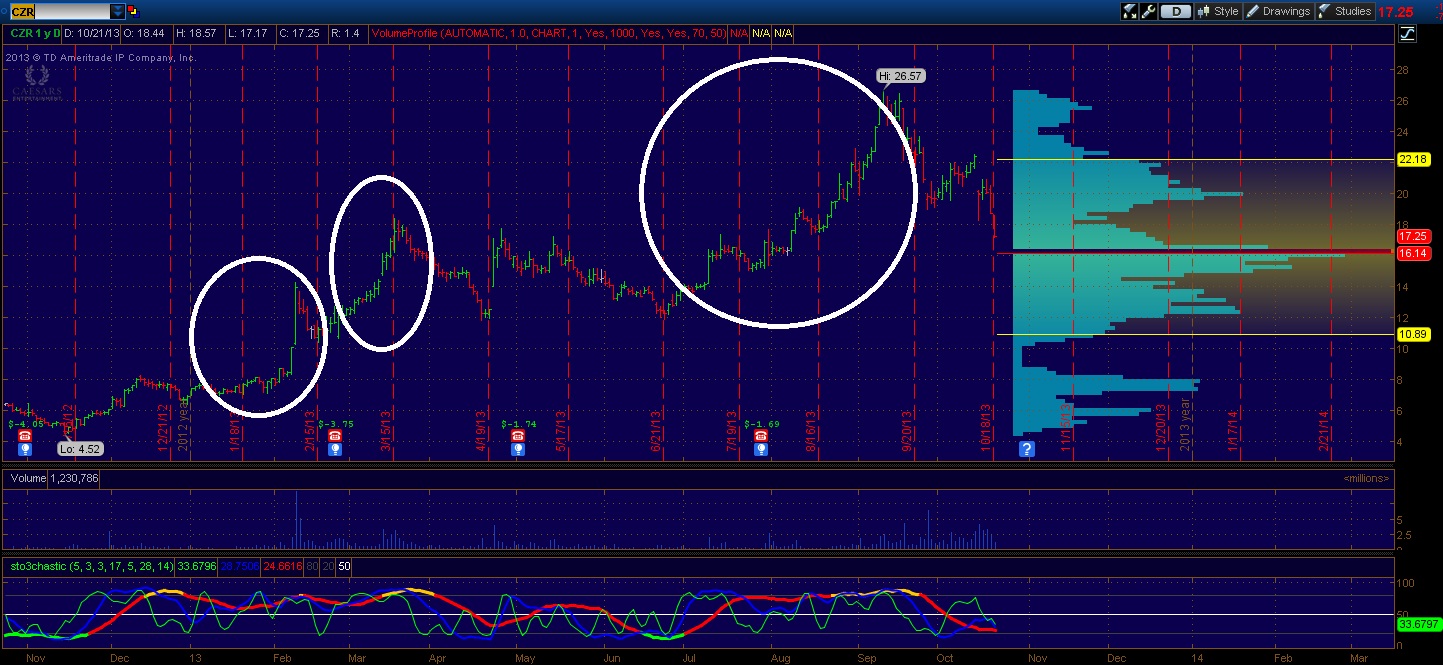
But what did the chart look like before the moves? How much of the volume profile was filled in by the recent movements? What did the volume profile look like before hand?
1)Determine the date when you want to “go back” to.
2)Click on the “On Demand Button”.

3)This message will come up. Click “OK”

4) In the top left corner you will see this.
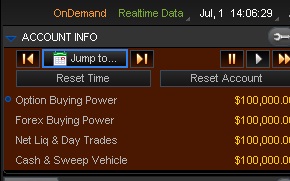
Click the “Jump to…” button to select a date for the “time machine”
5)The calendar will pop up… search through to find the date you want.
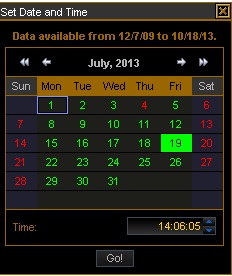
6)In this case we will choose January 29, 2013.
I am not looking for a minute by minute chart to see how the breakout developed today so the “time” doesn’t matter to me.

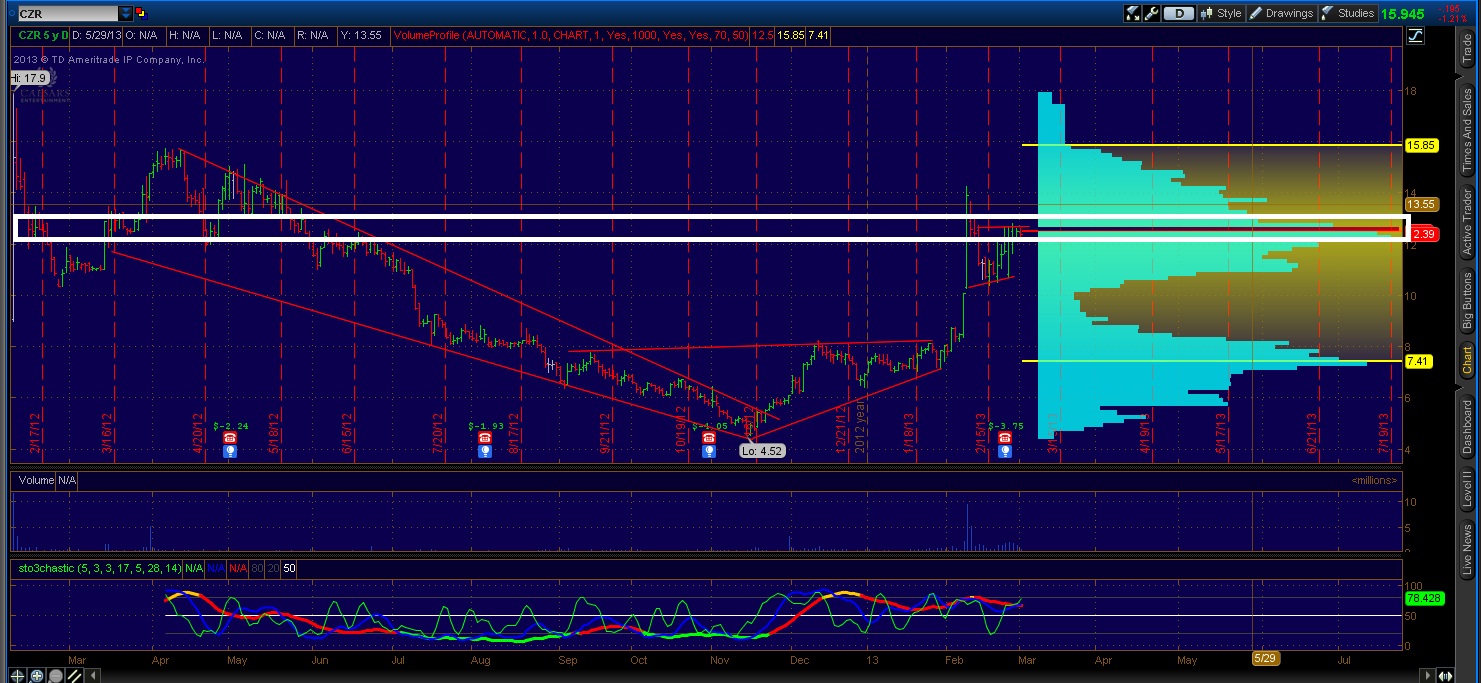
Now what if we want to see what it looked like as it was breaking through this first pocket? We might go a few days forward to 2/7… when the breakout was really getting started.
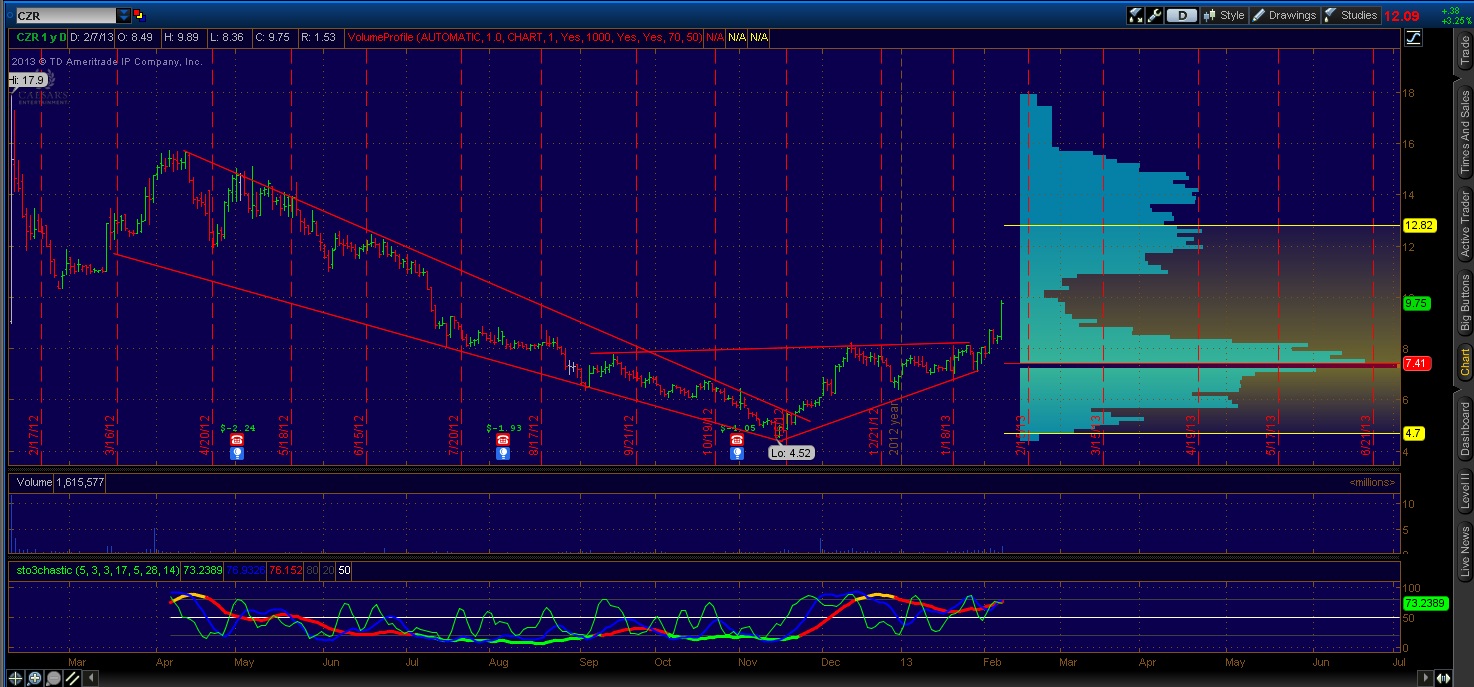
You can see the stock performed extremely well in a short amount of time as it broke out right into the volume pocket. Now what do you do midway through a volume profile? Fast forward 2 days
BOOM!. Extraordinary gains as the stock actually carried the stock with plenty of momentum and rocketed right through the reference point. If you sold short of the profile target, you could have missed a monster gain. Of course looking at one volume profile may not dictate what type of behavior you might expect. You also would want to look at what the other casinos were doing at the time. i don’t do this now, but you can if you wish.
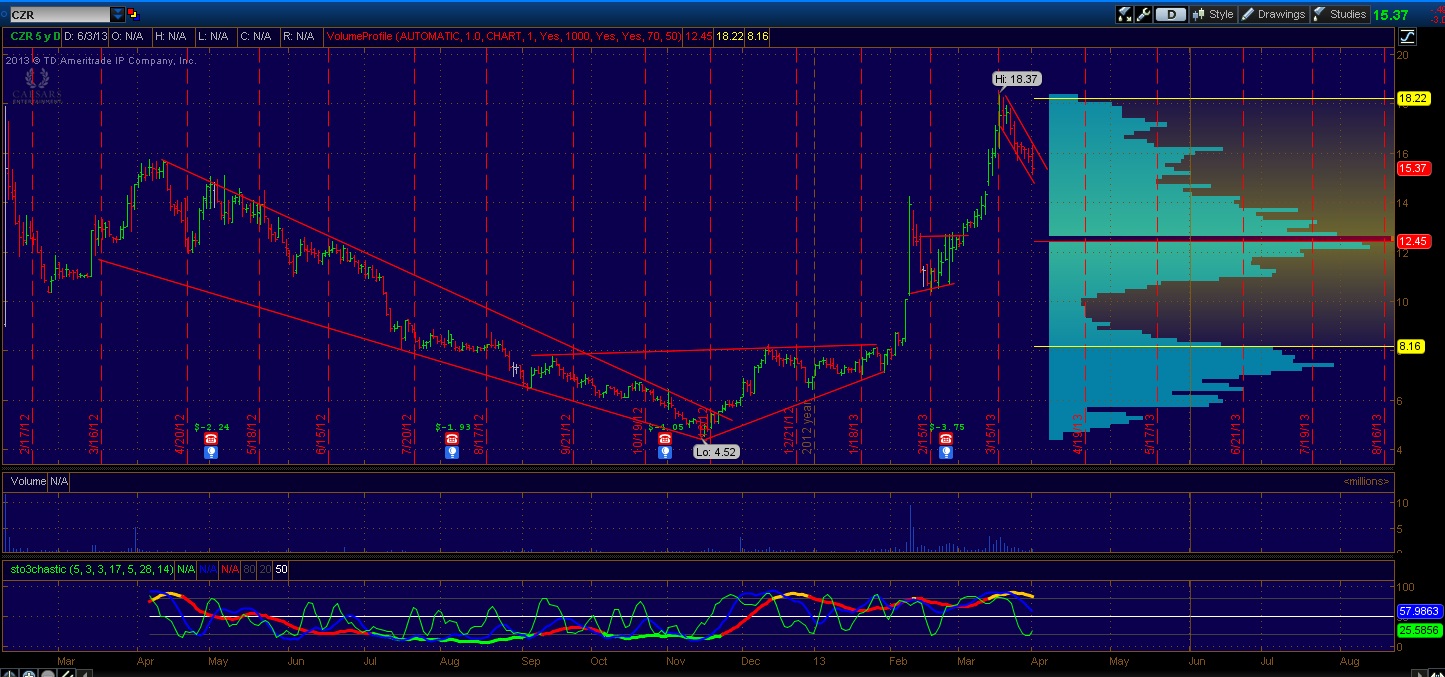
In hindsight, we also know the move wasn’t over. The stock consolidated for awhile and then broke even higher to the ultimate high above 25. So we can go forward some time again.
We can see that the stock consolidated and ultimately formed a “balance region”. Where there was plenty of supply and demand at current prices, but gaps both above and below. We see a flag or pennant pattern of sorts that usually acts as a continuation pattern so even with volume profile below, the bias should be higher if we can get the move to resume above the balance region. If not, it becomes a potential failed move and potential short.
So fast forward
This volume profile looks much different than the one before it as much of the thin overhead supply got filled in with more volume. The stock then begins potentially flagging in a short term wedge pattern.
I could go on and continue to study the run to above $25, but I will stop here, to encourage you to do it for yourselves. I would start with all the stocks that have gone up over 100% in the past year, starting with the biggest gainers over 50k volume. Just use Finviz to run a screen as I have done and linked to in the last sentence.
URL:http://finviz.com/screener.ashx?v=211&f=sh_avgvol_o50,ta_perf_52w100o&ft=4&ta=0&p=w&o=-perf52w
Then use TOS On Demand and get to work. To get out of on demand, you must click on the “OnDemand” button again.
Although you could abuse this and use it to develop overconfidence from hindsight bias, I use it to understand price action through volume profiles, and the volume profiles of some of the largest gainers. This way I avoid having to go through years of waiting and watching to develop that same understanding/experience. Sure, the past isn’t always going to be the same as the future… but if you wait for 2 years worth of watching volume profiles until you feel comfortable trading them, it may be too late. You can use TOS on demand to paper trade a 100k account and perhaps selecting from a list of say 20-50 stocks try to run that 100k up to 200k in a year and repeat until you are comfortable doing so and understand the swings in your account and the action in stocks… Try to pick stocks that you don’t know well enough to know what’s going to happen if possible and don’t study the chart before you “go back”. This will more adequately simulate the real experience and allow you to “immerse yourself” in trading.
Comments »