So I started working on an addition to the OABOT today. What I want to do is identify shorter term 1-3 day trades.The strategy will be to ride the coattails of the capital flows of an industry rotation, by looking for stocks that are not yet extended in those industries. Since it’s a 1-3 day trade, I am not concerned about any of the usual weekly or monthly trend action (at least as a primary indicator).
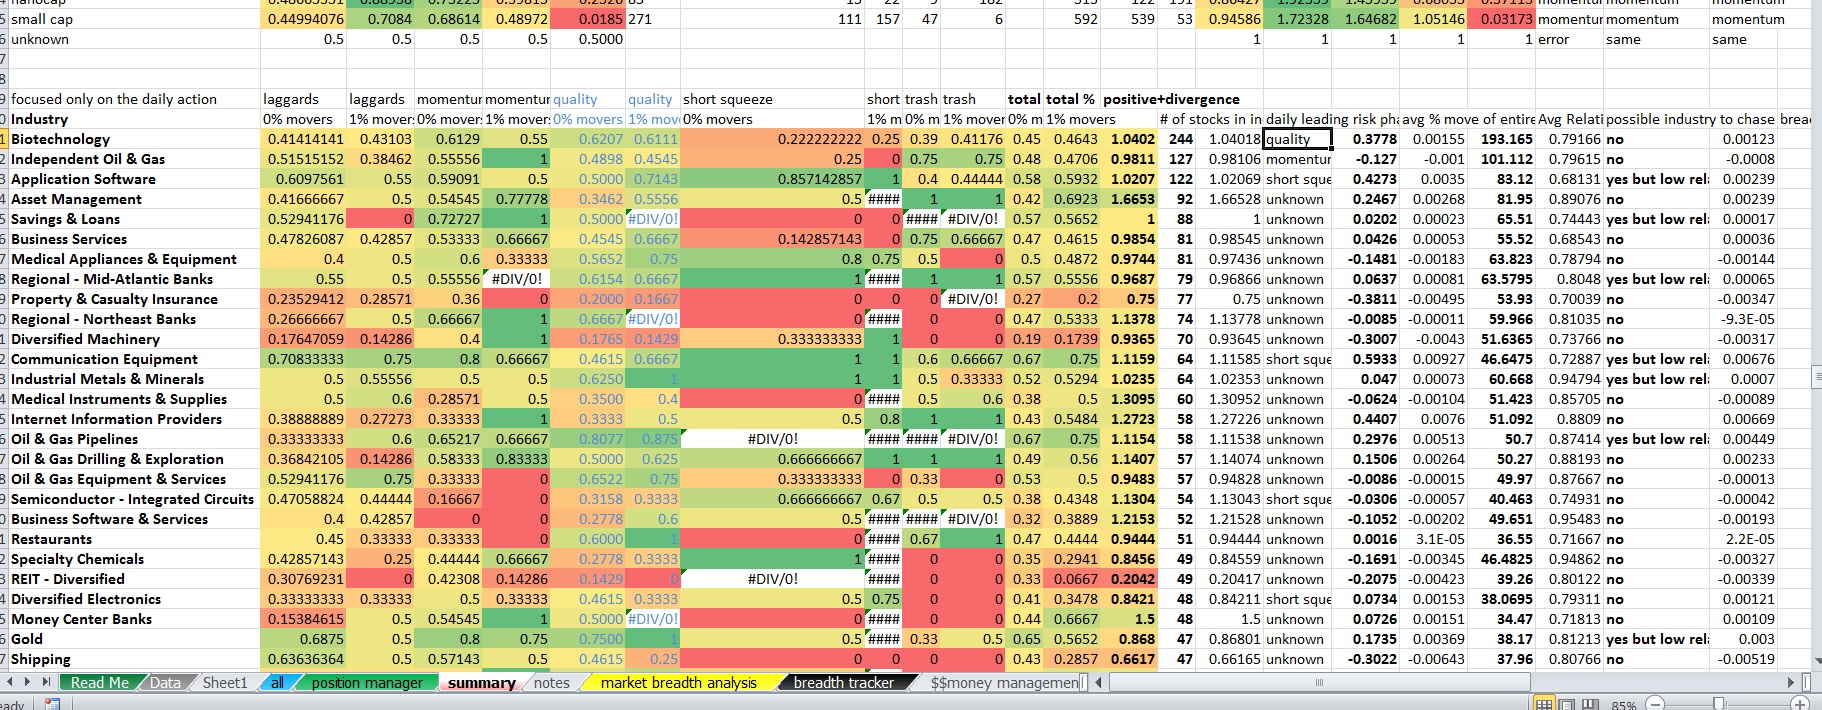
I start with an INDUSTRY scan of sorts. I want to actually identify industries with at least half of those names positive on the day, with at least a positive average stock move in the industry. I also want above average relative volume AND over 10 names in the industry, but may be willing to settle for results that don’t include those last two filters.
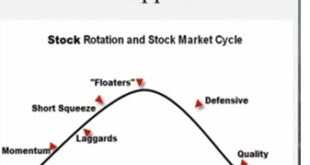
Meanwhile, I want a view on breadth 0% movers and 1% movers by TYPE across the industry, to identify what the daily action is signaling in terms of risk rotation which may later help confirm the anticipatory score and risk cycle that will be more designed for a 5-15 day trade.

What the primary purpose of this is, is to allow me to have a preset watchlist so that any of the stocks I am watching that start to show industry strength I can quickly check the charts and jump on if I like the action and the industry is taking off. I am really just going to watch the options that trade weeklies and then a list of a few smaller market cap stocks under $10 that tend to make large swings with decent balance sheets that I would consider for a day trade or quick swing, and possibly also a normal watchlist of a few names and use this tool to better help me time the intraday buy of stocks.
But there’s more. Even though a lot of the momentum move and rotation may retrace at some point, particularly if the longer term trend runs counter to the action, I hope that with a relatively few amount of details and information that I will be able to have some kind of edge in prediction direction just based upon 1-3 day momentum. The result of this action SHOULD change not only the individual scores AFTER this action occurs, BUT ALSO may indirectly set up certain themes for the 5-15 day time period. What I mean is this….
Say energy is down but solar is up. Lets say the larger cap solars have already rallied and may pull back while a result a number of Chinese solars, high beta, low float, high short interest, speculative smaller cap names are anticipated to rally and play catchup. As a result, we then can project that THIS action will provide not just a boost to those specific stocks, but in conjunction with all other anticipated moves, say the china names, the low float names, the high short interest names, the high beta names, etc will then begin to create a theme for the market that will provide a boost in score in 1-3 days . As a result of those themes providing a boost, names heavily tied to each of those themes, such as a few highly speculative, low float, high interest chinese internet names now will have a boost. The act of paying attention to the shorter term momentum will serve as CONFIRMATION on TIMING of not just china solar, but also increase the odds that chinese internet names sets up, and also potentially help anticipate a transition to higher risk into higher risk and a market wide boost to the short squeeze as and hopefully boost the accuracy rate in individual names as well as look into the future a bit farther by using multiple reference points to confirm the action.
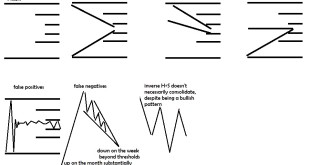
In other words, where as normally you might look at a wedge pattern and can’t be sure if you are going to have a name breakout of a pattern, breakdown, consolidate sideways into a triangle, or begin a trend, with the 1-3 day momentum and short term action you have helped to better fine tune and boost the odds that the Chinese internet plays should be more likely to work on the 5-15 day time horizon based upon market’s tendency to herd on “what’s working” and then find the “closest cousin” as a derivative to what is currently in favor. Potentially you can see what others can’t and do it without even having any DIRECT evidence of Chinese internet doing anything but consolidating for the time being. By the time many of these start to break out, you normally may be too late, or you may end up chasing… Without factoring this in you are guessing which setups will work and to what extent. With this model, I hope that the short term action (and projecting an adjustment to the score as a result of the short term prediction) can strengthen the 5-15 day score into a prediction….. Then hopefully by using such a prediction I can use it in conjection with my setup score and boost the hit rate of the typical setups we like anyways.
A slight edge in the short term in a number of similar theme stocks even if the individual play and timing is wrong should play into the rotation that adds up into an edge of a greater theme, and may spot warnings of interruptions to that theme working (say all things china are extended or breaking down. A rotation into the US and out of china setting up might derail the rally at some point, until other china names can consolidate and prepare for the rotation back into china where it should be led at that time by the outperforming higher quality setups that by that point may still be emerging in china internet and china solar.
IN TURN, I hope to also use the same concept to project forward the 5-15 day action and look a few more stages ahead and have what may evolve in the distant future into a full stock market simulator that can be used to practice trading and give you real time adjustments to scores and stock prices after projecting a few periods forward at a time. If this works properly, a small edge on 1-3 day time horizon, in conjunction with a healthy edge with a 5-15 day ranking fined tune using the 5-15 day time horizon…. will then project forward to say a 10-30 day longer term swing/trend with one’s own chart reading ability, will allow you to see many moves ahead, plan out trades many moves ahead, and have already prepared for the gameplan to play the next likely rotation. Since options are priced to decay exponentially, capturing a move that moves 1% per day for 30 days straight on a 30 day option would be much more profitable than an option with 3 days left that moves 1% per day for 3 days straight. The hope is to find out stocks which are the most mispriced according to the market’s tendency to herd and chase, and rotate up risk and shift from industry to industry and assimilate “what’s working” and “what is similar to that which is working” in so many number of different groups. Imagine a contract on say GOOGL with 40 days left and capturing a 30% move on an option 10% OTM even a small percentage of the time when the implied volatility is near it’s lows. Grabbing that LARGER swing will be unbelievable if you can do it… For now, this is just a concept I am working towards, but the idea in itself is stunning and really eye opening to how the market may actually work. Some further fine tuning and tweaking may allow a full map of the entire stock market’s anticipated moves in every stock (with a certain margin of error and probability of occuring) for an entire leg of a larger sector rotation,and possibly beyond. Worst case scenario it at least would describe a market in theory that may be very valuable in setting up a simulated trading environment. Even if the theory doesn’t hold up in reality, by setting up short term movements and momentum rotating intraday and lasting 1-3 days and having each group influence one another, you can still setup a market simulator with 60000 moving parts, add in a random number generator to create a lot of noise and only a small edge to the predictability, or less randomness and less noise to simulate environments with a greater edge and you can practice trading a theoretical market that may or may not be all that different from one in the not too distant future.
If you enjoy the content at iBankCoin, please follow us on Twitter


