Last week the volume on the panic was as significant as we’ve seen since the 2011 crash that coincided with a credit downgrade that was later given an “oops, sorry, didn’t mean it” and a debt ceiling battle that was later extended until September 31st.
What’s different about last week is that the VIX actually briefly surpassed the panic highs of 2011 and 2012.
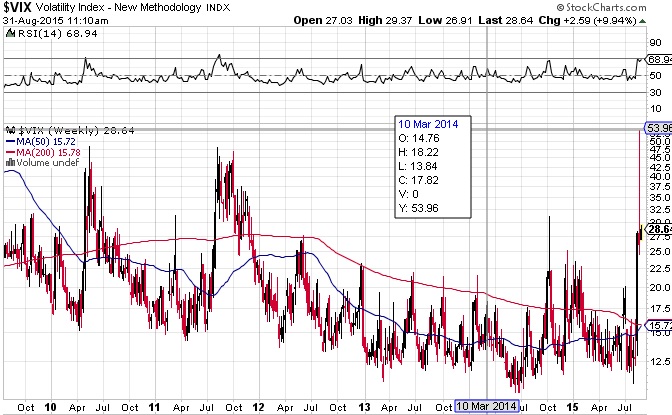
I believe that this can be explained by a lack of liquidity.
Most panics have little liquidity to begin with as people constantly seek a bid to try to identify some buyers from which they can sell and there simply aren’t any buyers that show up.
Option contracts are often theoretically priced according to the Black-Scholes model which says that there is a theoretical amount of volatility that an option is pricing in.
The problem is that option contracts just like the regular market are subject to liquidity. It’s the lack of liquidity in a panic and inability to stress test throughout time at more than a few decades at more significant panics that lead to the collapse of long term capital management in the late 90s following the Russian Bond collapse.
When liquidity declines as the market declines there is greater uncertainty at where the market is actually priced at due to widening bid/ask in the underlying. This makes it difficult for option traders to even determine a theoretical price that they can agree on. The person selling the premium wants to receive more, and the person buying the premium wants it for less. When the market itself is filled with uncertainty on price as well the price of at the money options in this instance was absurdly far apart.
The less participation, the greater of a problem it is and the more susceptible to wild swings in both stocks and options and implied volatility.
The panic last week coincided with brokerage platform outages. The implied volatility OF the VIX or “implied volatility squared” that measures the expected change in the implied volatility was off the charts and even surpassed October 2008, the worst of the financial storm.
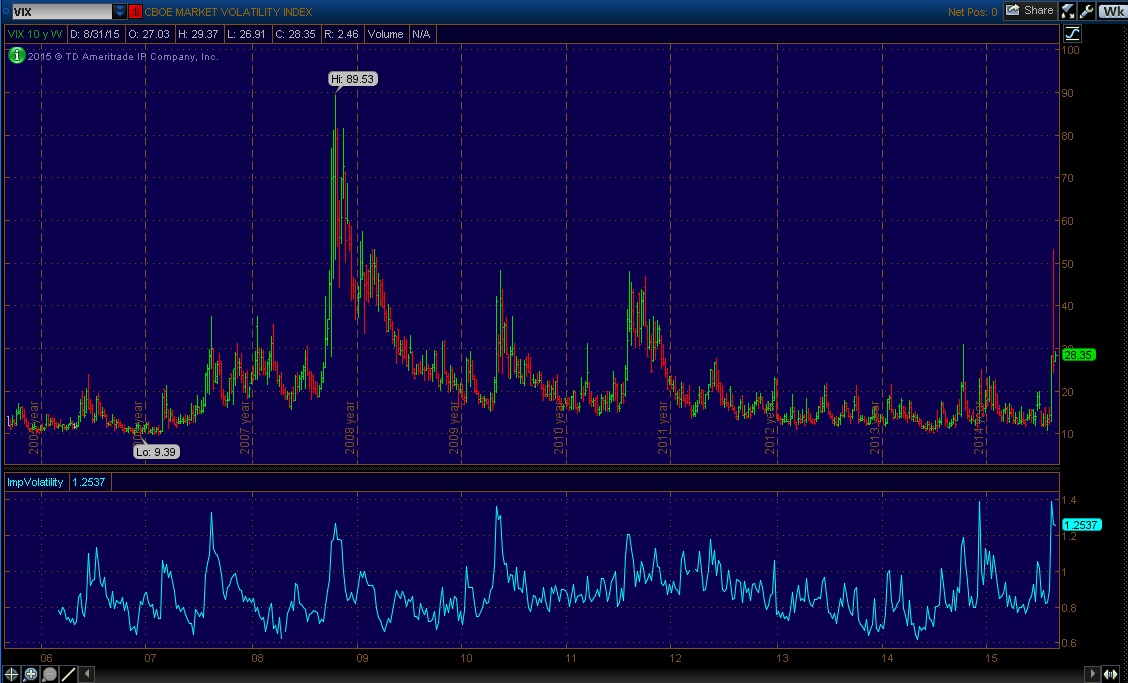
The Study below the VIX chart shows the implied volatility of the VIX.
So although the market was already overburdened with holders of shares that wanted out, it was the increasing uncertainty that came with a lack of liquidity that explains the reason behind the VIX.
Clearly something happened with the servers that run the major platforms as has been alleged by many, and this lead to crazy bid/ask spreads that were wide enough to drive a truck through.
So what does this mean for the market?
For starters, most retail traders and investors missed out on the best prices.
That’s not all that uncommon for a panic for the majority to miss out, but there still is a detatchment from the volatility you might have seen if fewer people had log on troubles and transaction troubles and difficulty even placing an order, much less getting it filled.
What it means though is those that did buy the dip had to chase it higher or were not able to grab a position of the size they desired.
I believe that means there’s a greater support underneath than advertised, but a retest will still create greater uncertainty because we didn’t have that price history that we should have.
In the contrarian philosophy of the “market moves to hurt the most amount of people” theory, enough people chased that I think at this point a retest of these lows will get even intelligent traders to be convinced that the bears are right, there’s no support below and that is the location by which you can get a lot of people who in 2011 finally swore they’d never participate in the market again until another crash that ended up buying the dip who will at the first sign things are going wrong sell and go away for quite awhile.
I think liquidity of the market in general is still not anywhere near 2007 levels and that most people are still risk adverse to stock ownership.
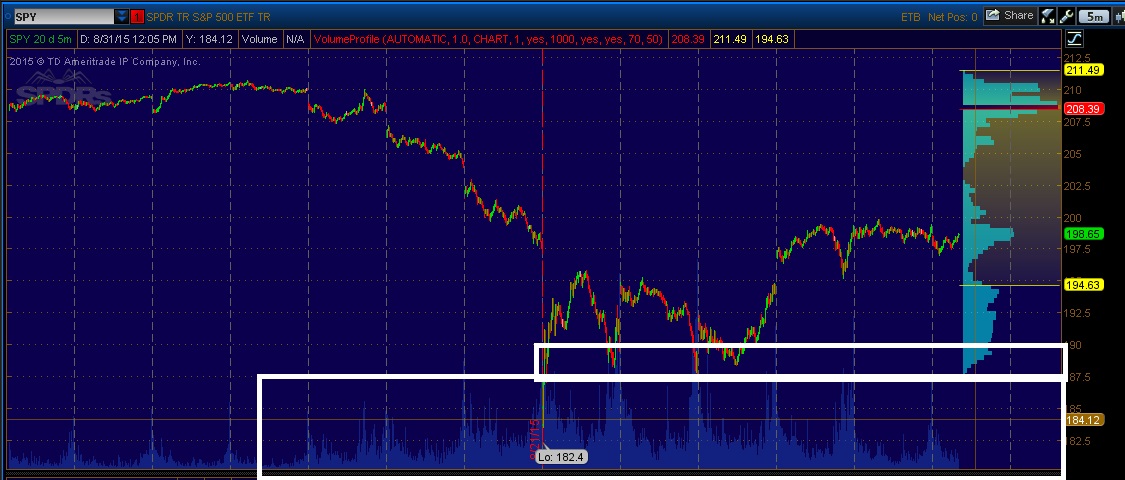
The longer term volume profile can give a clue of what’s to come.
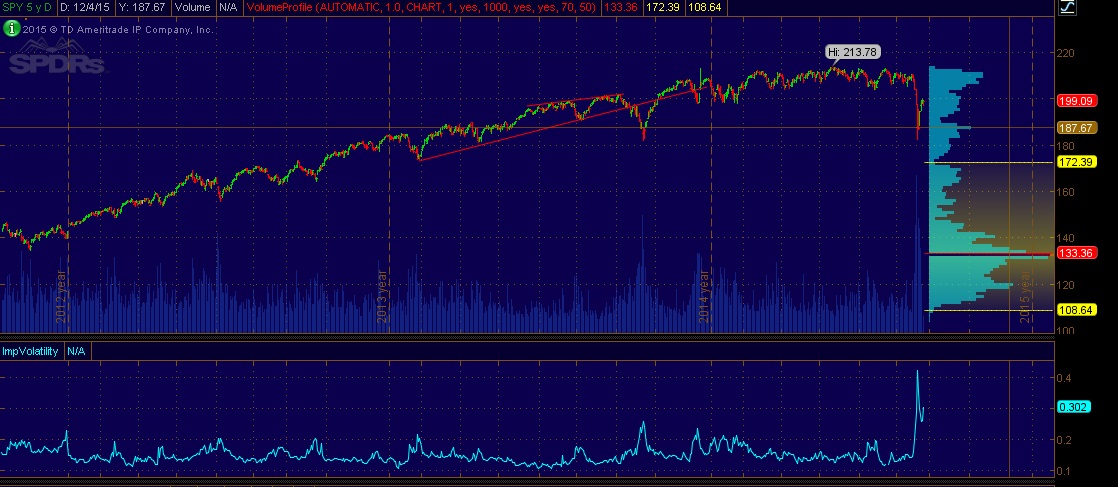
We are trapped in a sea of iliquidity. History of every recent panic suggests that it should last a lot more than a week. We should also see more volume come in for awhile and some price gyrations. Tat seems consistent with the charts and profiles. There is no real conclusive edge here on either side at these prices. The cost of hedging is too high. The option sellers are probably the way to go if you must pick a direction. A lack of price history and volume. Resistance above, support below. We certainly could see some wild moves ahead. But mostly I’d suspect that we won’t have a week that closes much below the 1875 area in S&P (187.50 in the SPY). Certainly those that bought back in the SPY 133 area have to feel good being up 50%, but there isn’t enough liquidity for them to sell. They need a mania high and euphoric press and the headlines that inspire the dumb money to jump in with both feet in order to start selling. If they do try to sell here for some reason, which isn’t entirely out of question but it’s less likely, they’ll have a lot of difficulty liquidating all of their shares based upon price history and prices would probably end up approaching 133 where there’d be plenty of buyers once again. There’s not really going to be smart money with significant assets that would sell only to re-initiate positions back at where they started because the institutional sized funds take weeks and months to acquire a position.
To emphasize, I could be wrong if a week does close 1875 range and if so and you don’t see capitulation and major volume, there’s no price reference for support until the 1330 range. I think that’s really low probability.
Until then just north of 205.00 should be resistance and just below 190 will be support. Standing at 200 that doesn’t leave a very profitable trade on either side.
We are in no man’s land. If I had to guess I’d say we stall and move back down to test support based upon the idea that eveyone missed out on the prices and chased higher and those who did chase higher aren’t going to continue to chase for much longer and the probably isn’t going to be a catalyst to get us above resistance with headline risk ahead.
I suspect the debt ceiling battle will be of major significance to the result of the election. If it goes off without a hitch, then confidence will be restored to the establishment candidates like Jeb Bush and Hillary Clinton. If not, the Ben Carson and Donald Trump or Bernie Sanders and Elizabeth Warren types will continue to surge in popularity. Martin Armstrong’s ECM date before the debt ceiling battle was scheduled for Sept 31st was October 1st and he predicted a rise in 3rd party and possibly 4th from within existing parties long before now. It is represented by the antiestablishment candidates, which may lead to a divide within an existing party.
If I had to make a trade I would buy OCT 210 call and sell calls at a strike of 205. You’re risking 5 to get about 1.5 (2.33-0.86=1.48, the spread between the two) if you hold trade till expiration. You need to be right more than 77% of the time to profit. It’s not that great of trade but Neither is selling a put spread up here after a bounce, and buying premium is out of the question.
I would look to sell a put spread on a decline and rise in the vix. If we approach support it’s okay to sell an at the money or in the money put and buy one close to support. A decline in price may see a rise in the vix which is usually good for selling premium.
Otherwise, I’d buy some XIV with a retest of support and possibly some TNA for a trade and I don’t think the toolbox of stock picking is available until the VIX declines.
update: sentiment
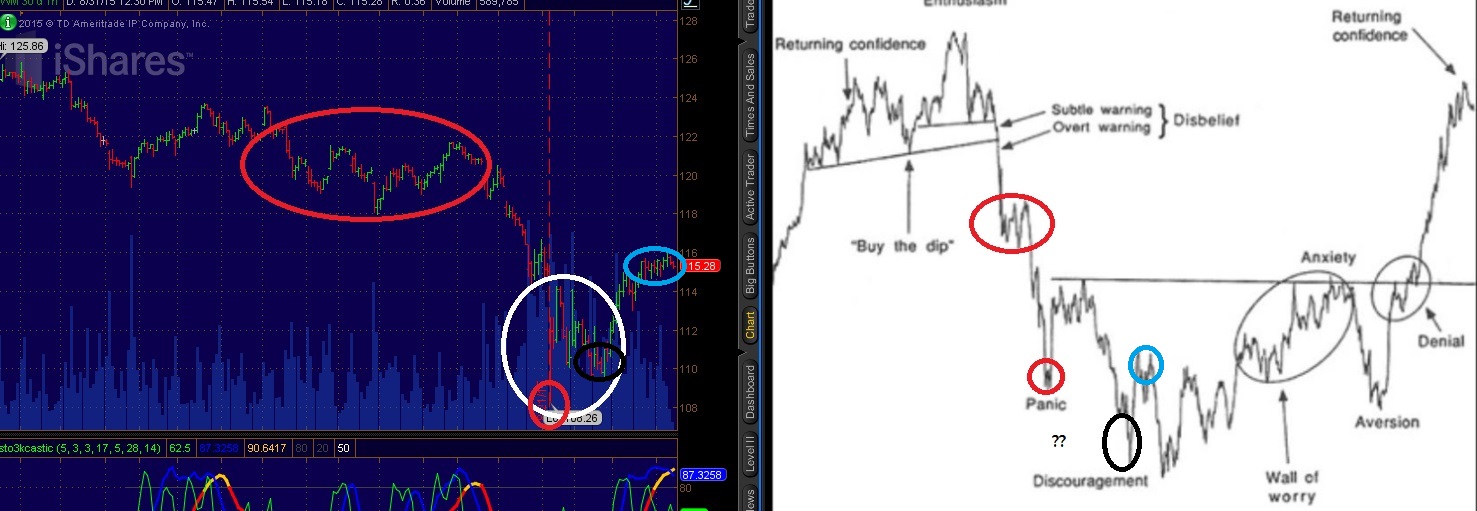
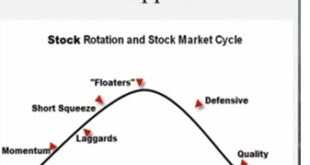
I don’t know If I have a great read on sentiment. I think it’s fair to say that this panic was outside the “standard deviation” of prior panic if only measured by the VIX and implied volatility of the VIX. As such, it’s fair to suggest that the “panic” portion of sentiment will result in the absolute low and discouragement can still exist without necessarily breaking that low. I don’t think it’s fair to consider the recent low as the “discouragement low” when clearly the market was in full blown “panic” mode as measured by the VIX at that time.
WITH that caveat, if I had to guess I think we’re in the discouragement phase now. However, it needs to be emphasized that the lack of liquidity and price history should provide less predictability and greater potential for surprise moves at least within the range of say 187.5 to 207.5; take my sentiment outlook with a grain of salt. But with that being said, I think there’s a reasonable roadmap to follow here that may emerge moving forward