 Bad Janet Yellen breath leads to bad market breadth.
One of the features I have implemented into OAbot is a sort of market breadth overview to give me a “big picture” idea of what is going on. Here is what it looks like:
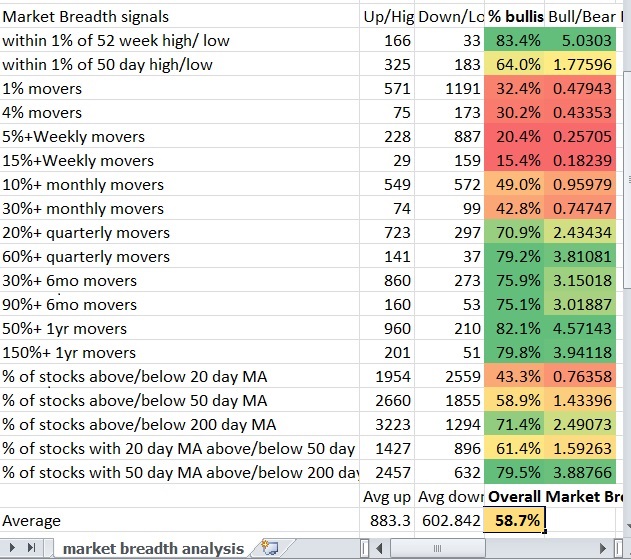
I took the % advancers divided by the amount of significant movers (advancers+decliners) to get the % of stocks of that particular move that are bullish. I made an adjustment since obviously a stock cannot be down 150% over a year so that it was the equivalent down move needed to bring a stock back to where it started. For example if a stock was 100% a 10% up move would bring it to $110. A $10 loss would take it back to $100 or a 9.09% decline. Therefore when I say “10%+ monthly movers” I am really comparing 10% up movers to 9.09% down movers. When I talk about 50%+ movers I am comparing the number of 50% up movers with 33.33% down movers.
You may notice some deteriorating breadth. It started with a big bearish move on the daily on Friday which continued on Monday on the daily and started turning the weekly bearish. Tuesday showed a lack of conviction on the dip buy and today on Wednesday the Weekly breadth is sharply lower and even the monthly is starting to turn. Various measurements via looking at stocks above their moving average have declined. The market had been overbought for some time and the sharp change on the daily is concerning.
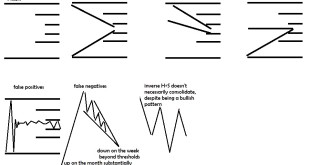
If we are to see aggressive conviction buying it will look like this: The extreme moves will not only make a dramatic shift from oversold to become bullish, but it will be lead by the larger of the two numbers will be signalling leadership. In other words, the 4% movers on the day will be even more bullish than the 1% movers on the day. The weekly 15% will be greater than the weekly 5% and the weekly 30% should be greater than the 10%. That is a bullish divergence in breadth that means business. A lot of breadth moves depends upon the context. Afterall, it really is just looking at movement independent of market cap to see what the market is doing. But put in context it can be powerful. But doing so some times is tricky. Overall breadth is still bullish, but it is difficult to tell if this is just a shakeout to the downside before another leg higher and the longer term signals to get aggressively bought and more overbought, or if the market is showing signs of rolling over.
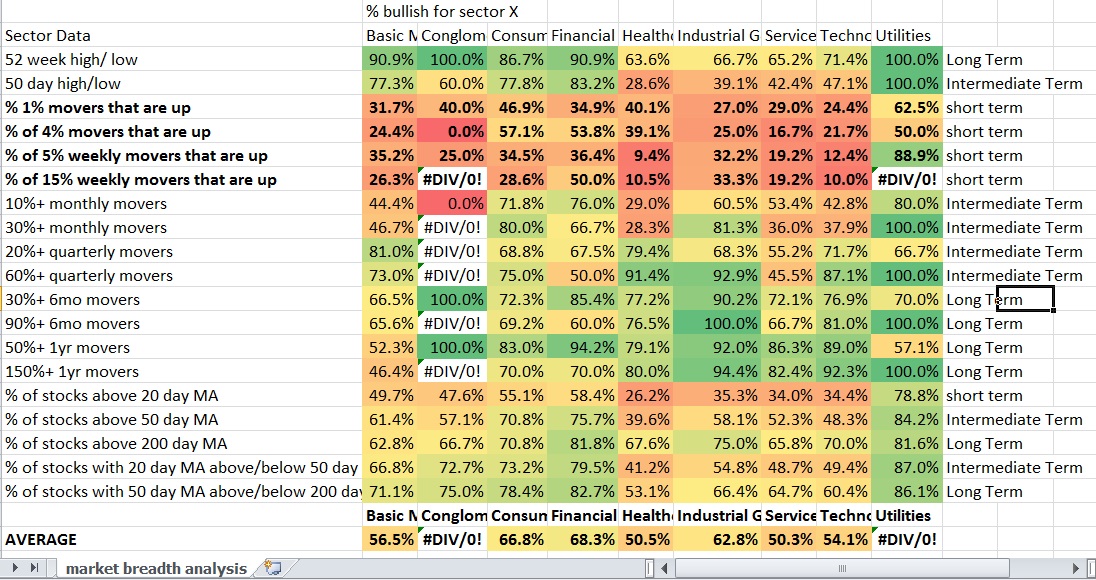
Further analysis can be done to the individual sectors to spot oversold areas, or areas that are leading off of significant lows, or just a more in depth litmus for the market. Unfortunately there is not always enough movers of a particular type within a sector to draw any conclusions. a 0% or 100% signal or an error message may just be a small sample size of movers.
The information may be more valuable if one were to track this data and provide a moving average of sorts over time to smooth out the results over the last 3-5 days or even over the last 10 days.
I am a bit confused, mostly because the bull run has been going on for 5 years so it is hard to interpret a shift off of every signal showing aggressive, perhaps some may say overbought conditions to this sell-off that is spilling over from daily to weekly and even monthly data is starting to shift bearish now. Nevertheless, I will let people know how I see it though.
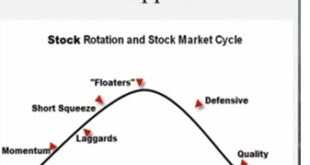
My interpretation is that one of the bullish things about this is that you are seeing individual leadership with Financials and consumer goods which probably wouldn’t happen if this was the start of a monster correlated rush for the exits pre crash or if this was a MAJOR top. It still could be a high/minor top before a substantial orderly correction, OR there could be a few disillusioned investors in these areas (less likely). The market had been severely overbought in terms of many of the longer term breadth signals, particularly the % of stocks within 1% or 5% of their 52week marks. This could be interpreted as most of the severe laggards on the “larger fractal” (higher time frame) have already gone, which may mean we are setting up for an epic short squeeze and euphoric conditions where the trash stocks start making their explosive moves and the market is just trying to shake people out before the move.
While it easily could go into some kind of euphoric, mania stage as many major tops do, and this is unlikely to be a major high or the top, eventually one of these kind of actions will lead to a lot more pain so it is prudent to be cautious. It is usually aggressive selling of everything that happens before significant corrections and bear markets. Even though you have a couple sectors leading for now, that may still change. Conversely it is the aggressive buying of everything that occurs during the early phases of a bull market (2009 as an example).
There are reasons to be cautious until we see some more significant signals. Healthcare which tends to go near tops had been very strong prior to the last couple weeks action particularly fueled by some biotechs really selling off. Utilities have had the best setups, remain strong and have had some days with large relative volume. Also a danger of nearing the tops…. I don’t want to downplay the risks that exist here.
With that being said, a part of me can’t shake the idea I’ve had since the end of last year which is that there will be a correlated selloff or two in early-mid 2014 which will lead to a breakout in late 2014-early 2015. The idea behind that is that the market is attempting to get the masses to miss out on stocks before even the dow begins to enter the secular trend mode and everything with it in a huge rip higher like the 1980s. The pension funds have to rotate into risk to stay solvent, so large and mega cap companies will have to trend higher, and one would think that the smart money would stay ahead of this move and rotate into some large and mid caps as well, sell into the pension fund buying and rotate into smaller and smaller cap stocks over time. Perhaps this is just a big rotation out of the small and mid caps and into the large and mega caps, and to interpret it as a sign of a correction is wrong. Nevertheless, so many stocks suggesting that the market is selling off is still a very cautionary signal that one cannot ignore.
The trouble of course with breadth is that it is often open to interpretation and is only useful when taken in proper context and when framed according to objectives and risk. Getting the context right is only occasionally easy. I will keep an eye on this as it develops. For now I am happy to be hedged, playing fewer positions and looking to raise a bit of cash when I can while rotating into financials.
Some Financials OAbot likes right now.
http://finviz.com/screener.ashx?v=211&t=AON,AJG,LPLA,RJF,HIG,EGBN,CHCO,ABCB,FBNC,CCBG,HST,BEE
If you enjoy the content at iBankCoin, please follow us on Twitter


that was brutal. By the end of the day when the margin clerks came by even the selling hit the financials and very hard. The breadth on financials 1% moves and 4% moves went drastically lower. However 50% of the 15% weekly movers are still up