Long series of posts coming up that will probably be quite full of words, but there is a lot that I really want to cover that I think will be a huge difference maker to many as a trader.
The typical market is made up of sectors that are pretty highly correlated with itself. Take for example, the S&P sector SPDRs, this is a correlation matrix.
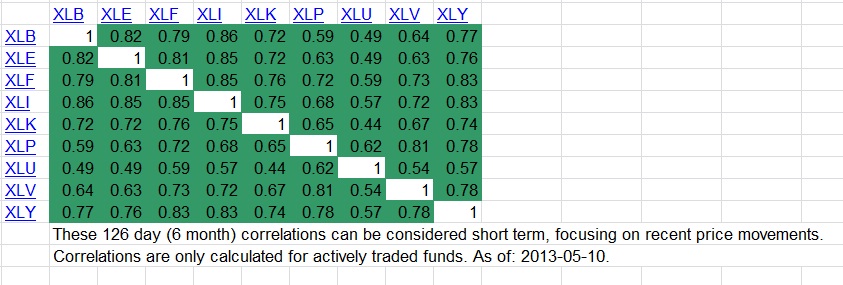
You might notice that the average diversified portfolio is therefore around a .70 correlation over the last 6 month period tested.
The closer the number is to one, the more a strategy should change into
1)Picking individual stocks as opposed to broad diversification.
2)Concentrating a portfolio in fewer names across fewer sectors.
3)Having more cash on the sideline (to compensate for a strategy that is more levered to the market’s ups and downs as opposed to the individual stocks up and downs.)
4)Considering “alternative” investments
5)Considering a hedge and often also using less “leverage” overall.
Return is very directly associated with correlation. You will see this through discussion of what’s known as the “Kelly Criterion” which long ago I blogged a bit about. Basically a “kelly” is the optimal bet size for ONE bet with the rest in cash given a certain probability of winning and certain edge (upside vs downside).
For now we can just use past illustrations of long term growth based upon bet sizes as a percentage of the “kelly” to teach you about risk and reward.
Say a person who hates money or never learned statistics or common sense offered you a game. Tails you lose your entire bet, heads you win your bet back and 2 more bet sizes on top of it. 2:1 odds on a 50% chance of winning. He also has guaranteed that this “game” will be available indefinitely. But you can only play with the cash in your pocket and you can never go back and get more.This is basically the scenario considered with a standard kelly criterion calculation.
If you put all your eggs in one basket, you eventually go broke, even though your “expected value” of a given flip is very high. The reason is portfolio volatility. But if you risk too small you don’t get to maximize the gain either.
This problem is actually calculated and illustrated nicely. As is any sort of bet that offers an edge. The assumption is you have to bet a fixed percentage of your bankroll, rather than gambling, doubling down, etc.
The kelly criterion defines the “ideal” bet as the one that maximizes long term growth rate. There are so many reasons not to risk this much and to risk LESS than this amount.

I have since constructed my own modified Kelly Criterion calculator on a spreadsheet that can handle multiple inputs of various probabilities of various outcomes. In other words, it’s better than your average kelly criterion calculator. I may upload this spreadsheet at some point to share it with those interested so you can experiment with different data points and see how it effects your long term return.
I have went one step further and used my understanding of correlation to also allow inputs of MULTIPLE assets (assuming the same expectations of probabilities of various outcomes) with a given correlation rate. In other words, it allows for 2 or MORE bets into different assets simultaneously. After this application it actually becomes possible to get specific numbers for constructing a portfolio. If you want, we can get into the math sometime, but for now just a brief conceptual understanding.
At some point, I even want to take this farther for it to give you a probability of a given drawdown over a fixed amount of trades (such as 20% over 100 trades) using the strategy so it gives you a better snapshot as it relates to risk. I will have to run “permutations using macros” which basically means running all possible combinations that a series of 100 trades could play out, weighted by their probability of occurring. From there you can add up all events where the total bankroll as a result of those trades at given bet size adds up to a certain threshold lost. It will probably be a few months until I get around to getting the spreadsheet to that point since I have other things to tend to.
Ultimately regardless of how sound the kelly criterion calculator and strategy as it relates to risk management is, it means nothing if you don’t properly model your expectations… and of course have an edge to begin with. Simply using past results or anticipated results may over inflate the results and lead to overtrading based upon higher perceived results or overconfidence. So the most important thing is to understand that in an uncertain environment such as stock trading, less is more, and that has actually been proven mathematically.
Payout Heads=200%, tails=-100% probability of each event=50%. Full Kelly achieved at F%=25%
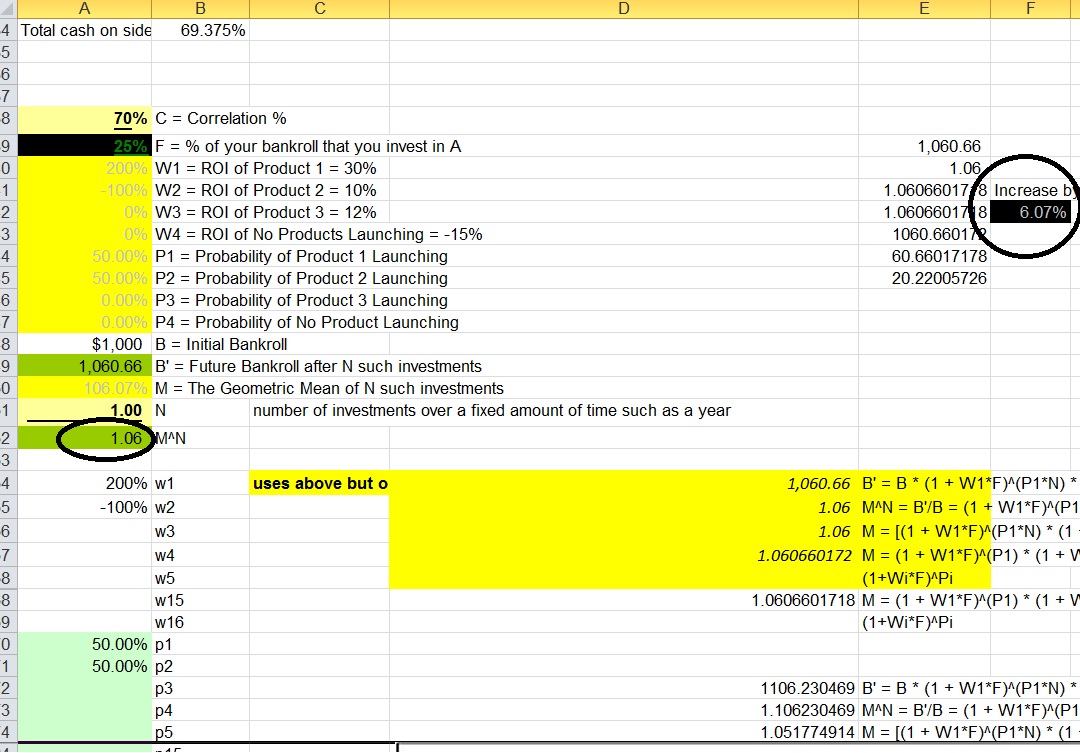
You can see that you can actually maximize your bet size by betting the proper balance. The actual amount can be calculated in this scenario. The full kelly or “ideal” bet to maximize long term growth rate per bet ends up being 25% of your bankroll. Maximizing long term growth is reckless in it’s own accord since that assumes you are around indefinitely to make up for wide volatility swings and maintain the composure to not capitulate and change strategies after. Anything beyond the kelly is insane because you don’t produce greater growth and incur much greater volatility and even risk of ruin if you go too far. If you bet a single cent beyond 2 times the “ideal” calculated amount you eventually reduce your bankroll to effectively nothing, it’s only a matter of TIME.
Additionally, you can calculate what your “wealth” growth rate is. Each bet would expect to have a long term growth rate of 6%, meaning your portfolio/bankroll GAINS 6% per bet on average. (Note:In the future, I have plans to use this to show you how to TARGET specific annualized returns based upon a given strategy.)
The spreadsheet itself will work with more than just individual “all or nothing” bets and can be structured for up to 16 outcomes (I could do more, but see no need). It also will work with multiple bets at a different correlation to tell you how much to risk per each individual bet.
In the next post I will go over how these concepts change as you use multiple bets correlated at less than 1, rather than just 1 all or nothing bet. In the future I will go into how you can use this understanding to optimize a portfolio for wealth accumulation, or target a return and minimize the risk while aiming for those expectations.
If you enjoy the content at iBankCoin, please follow us on Twitter