iBankCoin
Home / Money Management (page 2)

Money Management

Correlation, Options And Kelly Criterion

Long series of posts coming up that will probably be quite full of words, but there is a lot that I really want to cover that I think will be a huge difference maker to many as a trader.

The typical market is made up of sectors that are pretty highly correlated with itself. Take for example, the S&P sector SPDRs, this is a correlation matrix.
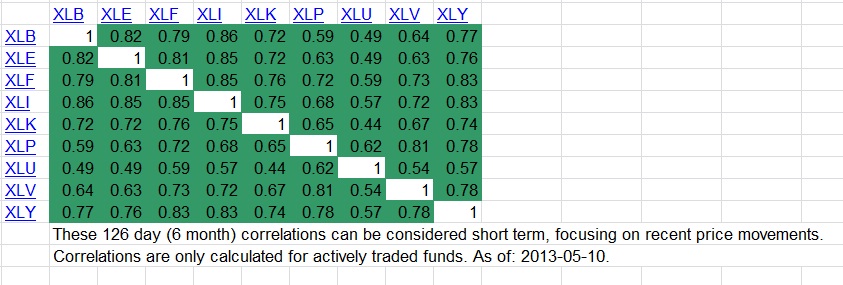
correlationofmarket
You might notice that the average diversified portfolio is therefore around a .70 correlation over the last 6 month period tested.

The closer the number is to one, the more a strategy should change into

1)Picking individual stocks as opposed to broad diversification.

2)Concentrating a portfolio in fewer names across fewer sectors.

3)Having more cash on the sideline (to compensate for a strategy that is more levered to the market’s ups and downs as opposed to the individual stocks up and downs.)

4)Considering “alternative” investments

5)Considering a hedge and often also using less “leverage” overall.

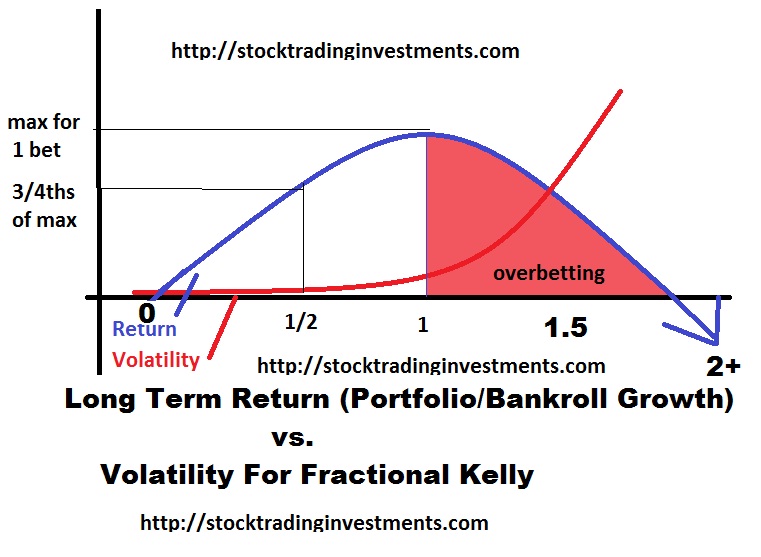
Return is very directly associated with correlation. You will see this through discussion of what’s known as the “Kelly Criterion” which long ago I blogged a bit about. Basically a “kelly” is the optimal bet size for ONE bet with the rest in cash given a certain probability of winning and certain edge (upside vs downside).

For now we can just use past illustrations of long term growth based upon bet sizes as a percentage of the “kelly” to teach you about risk and reward.

Say a person who hates money or never learned statistics or common sense offered you a game. Tails you lose your entire bet, heads you win your bet back and 2 more bet sizes on top of it. 2:1 odds on a 50% chance of winning. He also has guaranteed that this “game” will be available indefinitely. But you can only play with the cash in your pocket and you can never go back and get more.This is basically the scenario considered with a standard kelly criterion calculation.

If you put all your eggs in one basket, you eventually go broke, even though your “expected value” of a given flip is very high. The reason is portfolio volatility. But if you risk too small you don’t get to maximize the gain either.

This problem is actually calculated and illustrated nicely. As is any sort of bet that offers an edge. The assumption is you have to bet a fixed percentage of your bankroll, rather than gambling, doubling down, etc.

The kelly criterion defines the “ideal” bet as the one that maximizes long term growth rate. There are so many reasons not to risk this much and to risk LESS than this amount.

I have since constructed my own modified Kelly Criterion calculator on a spreadsheet that can handle multiple inputs of various probabilities of various outcomes. In other words, it’s better than your average kelly criterion calculator. I may upload this spreadsheet at some point to share it with those interested so you can experiment with different data points and see how it effects your long term return.

I have went one step further and used my understanding of correlation to also allow inputs of MULTIPLE assets (assuming the same expectations of probabilities of various outcomes) with a given correlation rate. In other words, it allows for 2 or MORE bets into different assets simultaneously. After this application it actually becomes possible to get specific numbers for constructing a portfolio. If you want, we can get into the math sometime, but for now just a brief conceptual understanding.

At some point, I even want to take this farther for it to give you a probability of a given drawdown over a fixed amount of trades (such as 20% over 100 trades) using the strategy so it gives you a better snapshot as it relates to risk. I will have to run “permutations using macros” which basically means running all possible combinations that a series of 100 trades could play out, weighted by their probability of occurring. From there you can add up all events where the total bankroll as a result of those trades at given bet size adds up to a certain threshold lost. It will probably be a few months until I get around to getting the spreadsheet to that point since I have other things to tend to.

Ultimately regardless of how sound the kelly criterion calculator and strategy as it relates to risk management is, it means nothing if you don’t properly model your expectations… and of course have an edge to begin with. Simply using past results or anticipated results may over inflate the results and lead to overtrading based upon higher perceived results or overconfidence. So the most important thing is to understand that in an uncertain environment such as stock trading, less is more, and that has actually been proven mathematically.

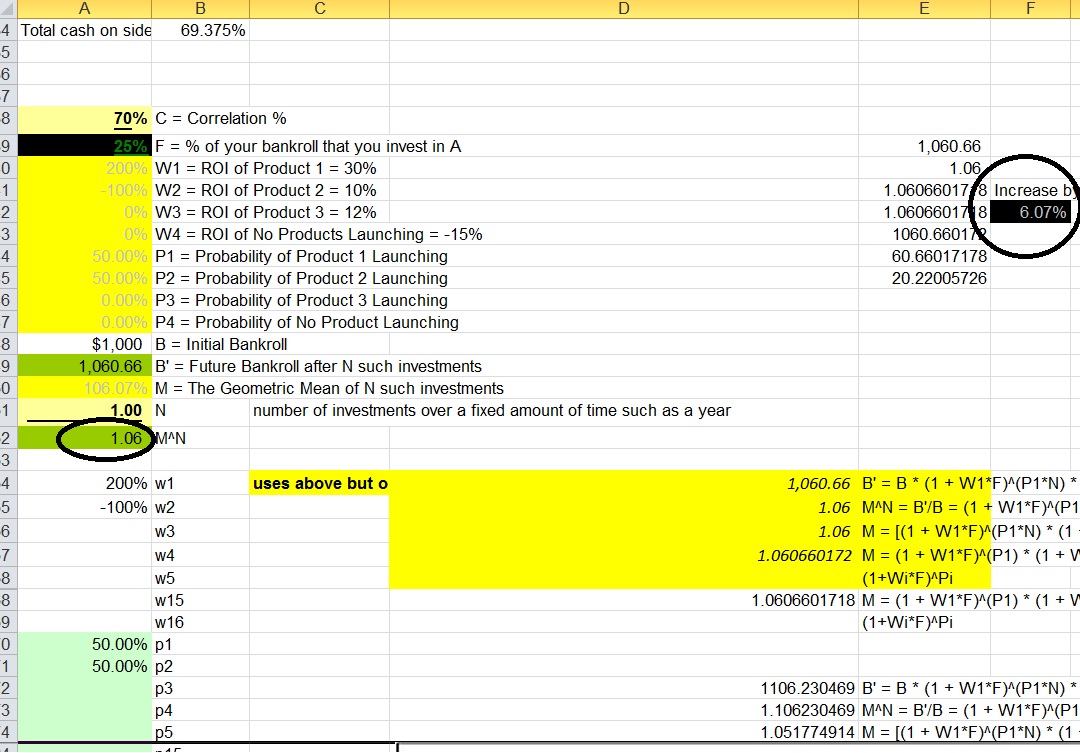
Payout Heads=200%, tails=-100% probability of each event=50%. Full Kelly achieved at F%=25%

coinflip

You can see that you can actually maximize your bet size by betting the proper balance. The actual amount can be calculated in this scenario.  The full kelly or “ideal” bet to maximize long term growth rate per bet ends up being 25% of your bankroll. Maximizing long term growth is reckless in it’s own accord since that assumes you are around indefinitely to make up for wide volatility swings and maintain the composure to not capitulate and change strategies after. Anything beyond the kelly is insane because you don’t produce greater growth and incur much greater volatility and even risk of ruin if you go too far. If you bet a single cent beyond 2 times the “ideal” calculated amount you eventually reduce your bankroll to effectively nothing, it’s only a matter of TIME.

Additionally, you can calculate what your “wealth” growth rate is. Each bet would expect to have a long term growth rate of 6%, meaning your portfolio/bankroll GAINS 6% per bet on average. (Note:In the future, I have plans to use this to show you how to TARGET specific annualized returns based upon a given strategy.)

The spreadsheet itself will work with more than just individual “all or nothing” bets and can be structured for up to 16 outcomes (I could do more, but see no need). It also will work with multiple bets at a different correlation to tell you how much to risk per each individual bet.

In the next post I will go over how these concepts change as you use multiple bets correlated at less than 1, rather than just 1 all or nothing bet. In the future I will go into how you can use this understanding to optimize a portfolio for wealth accumulation, or target a return and minimize the risk while aiming for those expectations.

Comments »
OK

So I continue to play both sides of the trade.  My FXY calls have been working nicely here, and I decided to add a real speculative June UUP $23 calls for a nickle today.  I wasn’t ready to sell my FXY but basically I am starting my rotation back out of the yen and into the dollar early. Remember, I entered the dollar and rolled some gains into the yen, so basically I am rotating it back except still holding the yen. The correlation between yen and dollar are not strong or inverted, unlike the dollar and euro which has a -.95 correlation.

As a result I can add and subtract at different times and both plays still provide negative correlation (but a very small one) to the market. This helps me keep my portfolio grounded when I get carried away buying a little too much.

I may exit my TRV put tomorrow if it doesn’t turn. I grabbed some SOHU puts today. So if I scratch out of TRV it doesn’t disrupt my exposure. If we trade higher, I close out of TRV and keep LNKD and SOHU on. If we close lower, then it is a bonus. My LNKD puts I am holding.

My GLD calls and FCX calls are still working well also. Had GLD not opened and closed above $135 today I would have scratched the trade. Lack of a follow through within several days after an oversold bounce is as dangerous as support giving.It is looking more and more like we retest at least $142.50, possibly even the $150-$155 mark in which case I would love to start getting bearish in the GLD again as I still think it can get to $1200 or lower before we flush out all the bulls.

I am watching oil carefully, I was considering buying USO calls and an energy related name today buy I was waiting for a pullback in USO to 32.50. 90 in the /CL works too. I want to get this out before market closes so ending the post now I will add some comments later.

I want names that aren’t highly correlated to the market here as we are stretched, consolidating and near longer term resistance. Additionally, as long as last week’s high holds and we don’t close above it, I am in no way ready to be too aggressively long overall. I don’t necessarily need inversely correlated names all the time, (like the UUP call, FXY call, GLD puts that I have done in the past) but I am trying to find the right balance that keeps me correlated closer to zero for now while still looking at plays that I expect to gain, while still allowing me to profit from a break either way or none at all. LOL, easier said than done.

————-

I got on the AFFY train today as it romped above $1.40 , taking out it’s previous high.  I’ve been mostly following Option Addict when I can on the long side and I passed on AMZN but got GOOG and another play I will keep quiet about… I don’t think OA has mentioned to the IBC crowd just yet today.

I was tempted to grab some gold miners, it wasn’t until late yesterday that I started to suspect they might for once actually not lag GLD and SLV and perhaps should GLD run, could even lead for awhile. But I already have some miner exposures on some metal plays, and FCX which has some GLD exposure (mostly copper though), and I was just a hair late to the punch this morning and they ran away from me.

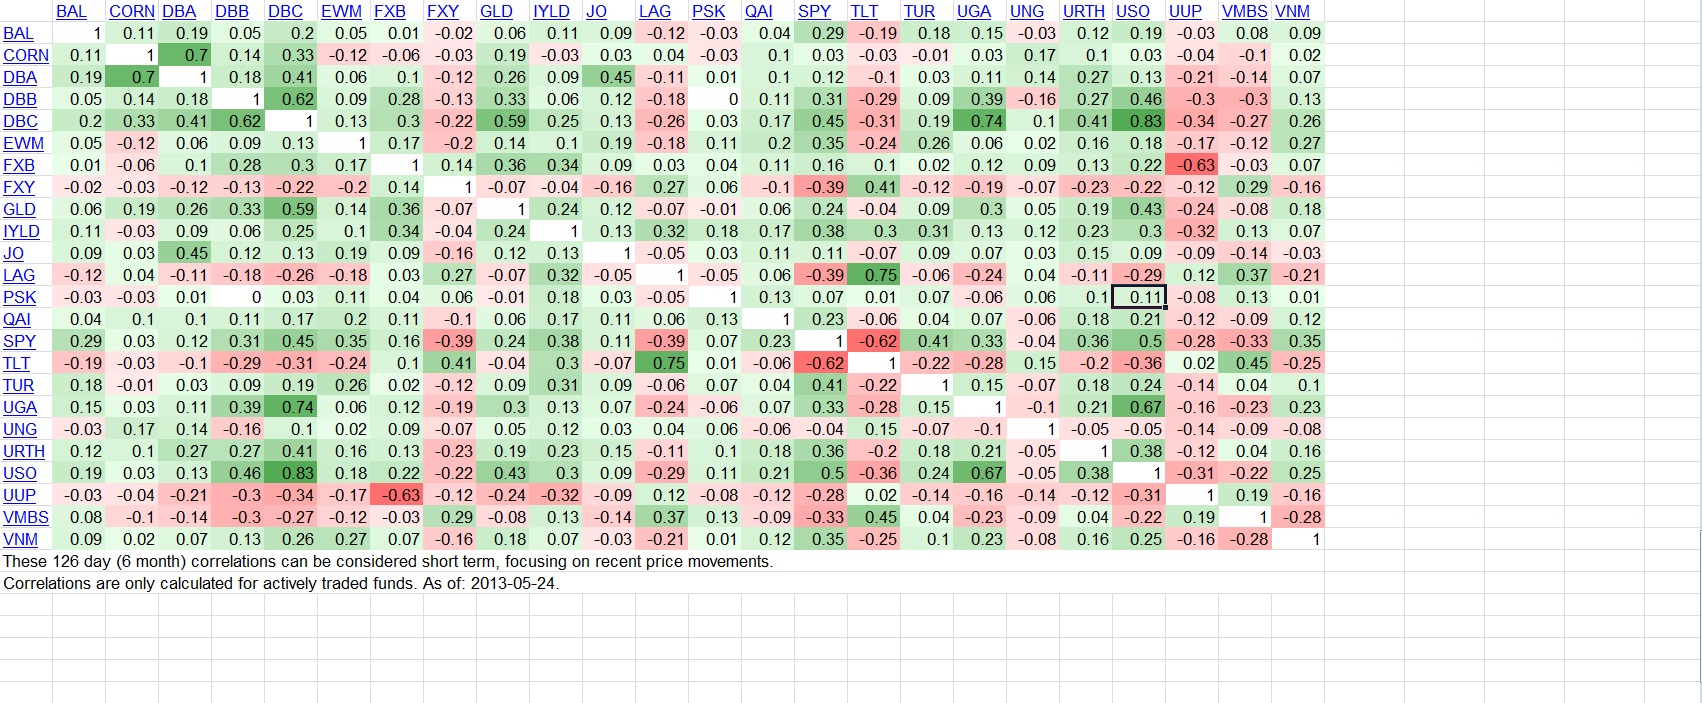
A lot of the same GLD miners are showing up on the same screens they were yesterday. But I also have REE,ESI,LEDS and some home builders on my radar tomorrow just as sort of a preliminary list.  I am also thinking about adding FRO down here to piggy back off the FLY. I am content to sit on my hands as well, but I should get a better clue as to what the correct play is here soon. If I still foresee more confusion as to direction, I will start looking at some plays in ETFs for longer term that have low correlation with the SPY. DBA on a monthly chart looks like a good spot to bottom pick with the new lows as the stop. Oil on a monthly chart is still in the process of setting up here, but I would say for sure into 2014 it looks good, if not into the upcoming hurricane season. This also may mean good things for the fertilizers and potash names. Here’s a correlation chart of some ETFs to look at for reducing your portfolio’s correlation to the S&P’s movements.

correlation

Or perhaps you prefer a list of ALL names and their correlations for the SPY.

I will have more on the value of “reducing correlations” and such later…. For now just understand that timing is still the most relevant factor, but adding low correlation or negative correlation plays can allow you to stay aggressive without having the same degree of directional market risk.

Comments »

Investment Strategy And Philosophy

I would like to say a bit on a matter of investment strategy and philosophy, sometimes repeating something that seems simple in isolation makes a world of a difference in how you perceive the big picture. There is a great guide to investing in stocks here that piggy backs off of many of these principals and better illustrates it using pics.

  • The market has no guarantees, therefore to take advantage of opportunities of lower prices or “dips” within a greater uptrend, you should always have some cash, and if you prefer some “risk off” etf (such as currency etfs or bonds etfs, or even perhaps a more aggressive short hedge.)
  • The market is not completely random, if it were and there were only the option of being long stock or cash, you would have 50% cash, 50% stock and rebalance and it would be the only way to make money and beat the market over a long period of time (if only very, very slightly.)
  • Furthermore, money flows in and out of various assets. If it did so randomly you could hold an equal amount of all major asset classes, and simply maintain that same balance with the similar concept of there only being stocks and cash, but this way you would take advantage of more movement of capital. However, generally on a relative basis one asset is more attractive than another, and thus you should shift your weightings based upon expectations of capital flows and value so you have more allocated in the more favorable assets.
  • Additionally, one asset may be more or less correlated in relationship to the others. The kelly criterion shows us that “independent bets” divided as small as possible and bet simultaneously produces the least volatility, and the most long term upside on risk. In reality, there are not really many independent bets, but “correlation” can be monitored, to avoid owning very correlated assets, and to produce an overall correlation to the market that increases with your degree of bullishness on the market (which should generally be greater on oversold conditions and uptrend signals). (see my post trend following strategy using sound money management principals)
  • The market does not go straight up over time, however it does trend up over a very long period of time. If it were to go only up, you would be over 100% invested, if the gains exceed the cost of leverage. The market over a very long period of time goes up as production increases and money gets added to the money supply, therefore you must recognize that getting short is a very aggressive and generally short term move, unless it’s used as a way to reduce your overall exposure to “risk”. If you do use short as a strategy, it should generally be less aggressive than when you are long.
  • Both buying the extreme oversold signals and reducing position on extreme overbought signals on multiple time frames, as well as following the trend have merit. Balancing these two factors should be a part of trend following.
  • When too many people get bullish and lack funds to push it any higher, tops are made, when too many people sell and run out of funds to sell, or get too exposed to a short squeeze, they lack the selling pressure to push prices lower. Therefore, the principals of contrarianism on a longer term basis have some merit as well and are worth watching in combination with OB/OS signals on a monthly chart to anticipate the end of the trend.
  • The market generally prices stocks by expected worth over a period of time compared relative to the other investments, with a few other factors considered. As a result, a 10% change in growth expectations over a year can drastically effect the price of the stock based on pricing it at 10 years of earnings over that time. A stock earning $1 per share with 0% growth might be worth $10 if you add up the $1 per share for 10 years. But with 10% growth, it becomes worth $15.93 assuming that growth is expected to consistently be maintained over a full 10 years. What’s more, in a year the 10 years worth of value will be 17.53 for the next 10 years if the growth is expected to continue. I explain this to illustrate both the pricing mechanisms in terms of expectations, and the dramatic effect they can have after big positive earning surprises and upward revisions, and to understand how big daily fluctuations in the market can still be somewhat rational. Additionally, both principals of understanding growth and value are important if you are choosing individual stocks, and if you are choosing ETFs, you need to still understand the value and the things that effect changes in growth in the macro economy. Growth is a very powerful factor, as such growth stocks offer greater potential as well as greater risk if expectations are wrong. The EMH (effiecient market hypothesis) is probably wrong to a degree, because everyone has different concepts of acceptable risks, and different ways to manage it, and different time frames, and everyone invests based upon expectations of earnings, which only need to change slightly to cause big differences in “fair value” measured by a stocks 10 years worth of earnings.the markets have proven to exist in mania phases. If for example, you expect demographics to cause a decline over a long period of time, but you are a short term trader, you probably won’t make any adjustments until it gets very close to the time frame in which the concern is there, and even then most investors who use earnings won’t project drastic changes based upon demographic trends
  • Please note the drastic difference in behavior of value and growth stocks. Value stocks may swing among optimism and pessimism, but is not dependent upon growth. Generally more money going into a company (and higher prices) makes a value stock less attractive because it yields less. It is only when that money allows the company to invest the capital and through a high return on capital produces growth that a stock going up can be a good thing. However typically value stocks become more of a target as they grow and must posses barriers from competition growing such as a consumer monopoly and brand name recognition to simply prevent contraction.
  • On the contrary, growth stocks for a large portion of their growth phase can become attractive if they are going up, (provided they don’t have excessive buying pressure in a short amount of time that is difficult to continue and are severely overbought). Many well managed growing companies use the additional capital they collect from investors to put to work in a productive way and further boost their growth and earnings. As a result, individual growth stocks in the right conditions can continue to go up for a long time until they reach a saturation point where additional capital becomes increasingly difficult to put to work to achieve the same kind of growth, which results in a decline causing some people to pull money out which contributes.
  • Additionally, since expectations of growth is relatively arbitrary, a more rosy expectations can see prices drastically higher, while less rosy expectations can put a stock drastically lower. As a result, opportunities present themselves to buy the dips and sell the rips.
  • A shift overall between growth and value can take place based upon the liquidity cycle and outlook and macroeconomic factors. If you expect growth to be inhibited, value stocks should be of larger weighting in your portfolio. If you expect growth to be strong, growth stocks may be best, provided the added risk of more growth can work within the context of your portfolio.

Taking into account all these factors and taking advantage of all these opportunities requires a delicate balancing of information and determining where to shift your assets. You have to be careful to generally go against the crowd at the extremes, but to follow the trends and lead the majority of the crowd in the trend. To buy an uptrend early enough, and hold onto it long enough to take advantage of the upward movement, but to still start selling into it early enough to profit and reduce position before the crowd does, and more aggressively start reducing your allocation when overbought. Meanwhile, identifying which assets specifically to bet on. Identifying the mispriced assets that offer high return with low risk. Perhaps you may also bet against those with high risk and low or more ideally, a negative return.


Comments »

Pull back likely

With markets severely overbought now, you have entered in the area where the return is likely to be less going forward and the risk is likely to be higher. The reason being that the more people that buy, the less on the sideline and elsewhere available to fuel the rally. Of course in the US, the money supply can certainly be expanded, but it is unlikely or at least less likely for a rally to continue for a significant length of time without a pull back.

Although over a short time period, bears are prone to getting squeezed out, providing potentially additional upside for those looking to make a quick trade, over the intermediate term, stocks will likely present a lower reward at these levels at higher risk, and the buying power is more likely to fizzle.

Stocks will be running into resistance based on volume profiles. There is a lot of transactions that may occur in this range, but not a lot higher. We can perhaps support maybe SPY 133 before the buying power fizzles. It will take a significant amount of buying pressure to push above these spikes in volume. We also will be in the upper range of price

We are quickly approaching levels where the transactions pick up. The number of transactions puts a ceiling on pries for the time being because it would require a lot more buying demand to overpower it and is more likely to take time.

More importantly, going into these levels we are overbought on both a weekly and a daily chart, while a monthly chart remains in a downtrend with a bearish divergence (but is testing it’s limits). This is additional evidence that there will not be enough buying power to drive much farther past these levels.

And the daily chart is egregiously overbought as well.

Not only the slow stochastics which is more common, but we are overbought in the RSI and nearing the upper bollinger band. The Dow and Nasdaq aren’t looking much better.

Yes stocks can remain overbought longer than many people anticipate, however, it just doesn’t tend to be sustainable. At a bare minimum you simply have to consider reducing into this strength. You may be able to get away with it, but it only will take that one 1929/1987/flashcrash type day to ruin years worth of returns if you are aggressive into that. One of those days can wipe out all of the days in your trading career in which you pushed the envelope and got ahead of everyone else. If you are managing other people’s money professionally, it’s a different story. People freak out if you only make 5% when the market is up 7% and when you are only up 3% but everyone else is up 1% they love it. That’s just how it is. But as an individual investor, you should recognize the luxury that you have of not having to beat any particular benchmark on a regular basis and if the market proceeds to throw you out in front of a freeway picking up nickles you are not forced to play. This is the insanity that goes on that leads to conditions being at such extremes. The money flows into the fund manager’s hands and they have to put it to work before the other guys do and then they have to put it to work to keep up with those around them. They flock together and crash together.Have fun playing that game with them if you like, I will use the extremes as opportunities to do the opposite, even if it means underperforming into a hot rally.

Of course, as mentioned in the trend reports, mutual fund cash levels have still yet to raise significant cash, and that makes the stock market vulnerable on a longer term basis as it lacks the mutual fund buying power. We have not been at levels this high since before the November crash that took place followed by the S&P downgrading the US credit rating.

Additionally QE2 effect is perhaps going to be wearing out soon, and Europe’s crisis will eventually come to a head. Nevertheless the question “what if it doesn’t” and “what if all the negative stuff has been priced in for quite awhile now” is relevant and valid.

Nevertheless, if you are ever to consider to initiate a short position, I would begin to build a position at these levels. 133 on the S&P may be a bit more ideal if we get there. Certainly a reduction of risk and an increase in plays that do well in a bear market makes sense here. If there’s ever a time to take some profits, it is now. If you want to play with the odds in your favor, you have to reduce positions when stocks are higher and the trend is stale to the upside. Right now the weekly and daily trends are stale, and the transactions are on the high end or the range. I can’t imagine getting a better opportunity. It may be a bit more prudent to wait and if SPY hits 133 until you can then start to short. As we saw before the flash crash as an example, or before the May top in 2011 stocks certainly can stay overbought for awhile. Trend following only works until the trend has played out, then you must leave the pack if you want to avoid becoming a lemming and falling off a cliff. That doesn’t mean you have to go against them and short, but it becomes a possibility.

At some point, you have to recognize the advantage from following the trend is gone if the people you follow lack the buying power to push it higher. You don’t have to be a hero and lead the bearish crusade against the bulls, but you should at a minimum scale back. In the post trend trader I talked about a contingency plan for if the weekly uptrend continued and we got into significantly overbought territory across the board, and to have plans to potentially get more “aggressively conservative”. I believe it is a good time to do just that and begin to shift into an even more conservative portfolio, and possibly consider dipping into bearish territory if this continues for much longer. I don’t know how long this “aggressively conservative” period of time will last but it potentially could be short lived if we get drastically overbought on a weekly and daily timeframe and continue the charge upward, closing the month high enough to result in reversing the monthly trend from bearish to bullish, or if we pull back sharply and no longer have such extreme conditions, and then we may build a more sustainable rally. With everything overbought, the dollar could pull back and the market rallying for even longer would not be out of the ordinary before it has perhaps a healthy correction and maintains an uptrend.

Despite the overbought nature, capital is seemingly concentrating into stocks right now and flowing into stocks strongly enough where the monthly trend is likely to shift to bullish if we do not get a pull back very soon. It is unfortunate that it had to become so overbought on a daily and weekly timeframe to do that, but if we get a close around these levels or higher, it will signal a change in the monthly trend.  The monthly trend provides both a sense of direction on whether liquidity is increasing or decreasing and whether growth expectations and longer term capital movements are going into stocks which further helps productivity. All the capital in stocks could further provide opportunity for companies to invest that capital, which could lead to increased production and growth (to a degree for awhile) until the market becomes over-saturated with capital. It is only after a significant monthly rally that this occurs and it then lacks the opportunity to continue to put it to work at a high return and growth becomes impeded by the market itself as competition grows and gets in the way of itself and too much capital becomes a problem for companies and too few places for that capital to go and too high of expectations of growth and an inability to meet those expectations or continue to support such sentiment. It is a delicate process handling an increasingly overbought weekly and monthly chart if the trend changes bullish. Ideally we will pull back strongly and be closer to oversold on a weekly and daily timeframe as we finish just strong enough to change the trend on a monthly chart if we are to rally. However, even if that happens there is still a bearish divergence in the monthly chart as stocks made higher lows as the slow stochastic and RSI made a lower low. So there is a higher probability than not of a change in trend, if it occurs to be a false move.

I wouldn’t be too concerned about the monthly trend changing on us just yet though, for now you still should be expecting a pull back to be a high probability event and this very well could turn out to b an excellent selling opportunity, particularly if the downtrend continues on the monthly chart and we get another wave down.

In my personal account I bought a TZA position today. I couldn’t resist speculating here.

Mock portfolio using principals I have discussed on here is up nearly 14% since October when I started due to some arbitrage gains, and some adding and reducing at the right times with different assets. Considering the bearishness I have tended towards, I consider this an impressive feat. If I played the weekly uptrend a little more aggressively to the bullish side it would have been more impressive.

Higher risk and lower reward does not automatically mean betting against the market will be profitable, it just means that you should be able to find other assets that support a better reward with lower risk, that aren’t so vulnerable, and that reducing position may be a good idea. Also, shorting as a hedge to reduce position size if you aren’t really willing to sell individual names may be one way of reducing your risk. There is most likely a higher probability than usual of a pullback right now, or at least a pause in the action. If you aren’t using this price run up as an opportunity to take profits and reduce positions, when are we ever going to be overbought enough where you are? Personally, I do think betting on the pull back is likely to be profitable, but I am not willing to do so too aggressively, other than just to reduce the risk exposure of my portfolio. I do not feel comfortable buying many currencies or treasuries in large quantities, so shorting to reduce exposure seems prudent.

Comments »

Trend Following Strategy Using Sound Money Management Principals

I’ve decided to keep this blog on ibankcoin specific to trends. To keep this blog on topic I made a post at stocktradinginvestments.com titled Kelly Criterion Shows Decreased Correlation Increase Return. The short version is the picture worth a thousand words.
Kelly-Criterion

Reducing correlation (and thus increasing your independence of your bets) is important because you can reduce your draw-down, or increase leverage in multiple uncorrelated names and keep the same draw-down with higher long term returns. If you lose 20% you need 25% gain to make up for it, but if you are invested in uncorrelated assets, a 20% loss will be much smaller as your overall portfolio, even if you have multiple uncorrelated bets with leverage. That is the idea.

What’s this all have to do with trend following?

As great as it would be to go “all in” in the best possible area and get every single call right, that isn’t realistic.
This is why I propose you set minimum holdings for risk on assets (stocks,natural resources&commodities,etc) and minimum for risk off assets (currencies&cash, bonds,). But also consider other lowly correlated opportunities. Depending on the trend, you would adjust your weightings, but not necessarily neglect opportunities if it keeps your portfolio’s correlation low.

When stocks go down when you expect them to go up, if you are 100% invested in stocks you not only are down in your position, but you also lose in opportunity to rebalance at lower prices, and in some extremes even change your allocation to be more aggressive. There is a fine balance between trend following and value investing. Value investing principals would suggest that if you are bullish if a stock is at $100 you should be more bullish if a stock is at $90. Trend following is often, but not always, in conflict with this, especially in individual names vs indices. This means you have to be positioned within a trend both to take advantage of the directional move, and also to take advantage of fluctuations in prices away from the trend (contra-trend moves), and to position more heavily if the signals are stronger. But unless you are 100% certain or the move severely outweighs the downside of it going against you, you do not want to be 100% in any asset class. Additionally because daily and weekly volatility (noise) exists within a monthly trend, it still may be right to have some funds you can transfer, despite also being “right” about trend direction since we still may have opportunities to add stocks lower in a monthly uptrend, or add to TLT or “risk off” trade at a lower price in a monthly downtrend (downtrend in equities, that is). For this reason we set parameters.

So we set parameters of maybe 75% maximum and 25% minimum for both risk off (bonds) and risk on (stocks). (You could certainly go with less or more depending on how you want to push your risk, and maybe make an exception or two). We also want to keep what we learned from the linked to post in mind and make sure an area of low correlation has it’s place.) Having this much is a bit more for longer term traders and contrarians looking to preserve enough cash in the event of a big plunge. If you are more nimble and more accurate go ahead and change this, but the rare times you get caught long in a big decline or vise versa, you will often make up for all the opportunity you missed out prior to the big run. Another solution would be to find more pair trades and hedged positions.

Overall though, you have to not only keep track of the trends in stocks, but in the alternative investments.

To keep things relatively simple, I came up with a general guideline to follow for stocks. I started with defining what type of trend we are in . We can be in 4 trending conditions:

Monthly trend up, weekly trend up

Monthly trend up, weekly trend down

Monthly trend down, weekly trend up

Monthly trend down, weekly trend down

Then I threw in overbought and oversold conditions. Within each of those trending conditions there are 4 possibilities. Either no extremes, weekly extremes, monthly extremes, or both weekly and monthly extremes. This gives us 16 potential scenarios to account for. (In reality there are more because 3/4ths of the trend signals for example can signal an uptrend) If you want to use The PPT OB and OS signals there are 32 potential scenarios.

The simple way is rather than make 16 more adjustments, to just note the 16 conditions first then as a rule of thumb subtract 10% from stocks and add 10% to bonds when PPT OB and -1% from stocks and +1% to bonds every additional 0.1 OB points it gets. And for PPT OS to add 10% to stocks and subtract 10% from bonds and add +1% to stocks -1% to bonds every additional 0.1 OS it gets. A more complicated solution would more aggressively sell the overbought signals and more cautiously buy the oversold signals when weekly trend is down (but not oversold), and more aggressively buy the overbought and more cautiously sell the oversold when weekly trend is up (but not overbought).

Then I went through each condition and came up with a potential allocation. To keep it less complicated I just chose “Arbitrage” as the low correlation play mixed in with “treasury bonds” and “stocks”. In reality, “gold” “natural resources” should be considered for “risk on” plays as well. And “currency”should be added in addition to “bonds” for “risk off” plays. Adding in MORE lowly correlated assets and using leverage when appropriate will increase return without at the expense of volatility and long term growth.

In some conditions, leverage is allowed to be added depending upon the asset class.

Since originally writing this article, I decided to keep an eye on these as a guideline, but to change the individual assets. So the principals remains in tact of what percent is “risk off” asset and what percent is “risk on” and what percentage is “arbitrage” or “minimal correlation” to the rest of the portfolio. But the actual percentages changes based on trend.

As you saw in my most recent post the trend trader, I came up with a sort of “model portfolio” to follow in the current conditions. In reality, I may shift a lot more heavily to arbitrage if the deal is right and I may leverage it if the deal itself does not seem to require leverage. For example, if Apple or Google bought something smaller, they would probably have enough cash on their balance sheets and the concern of the deal going through would not depend on availability of credit. If the economy turns south in a hurry as it is vulnerable to do in a monthly downtrend and weekly downtrend, or monthly downtrend with a weekly overbought condition, deals can fall through, so avoiding leverage, keeping that percentage of your portfolio towards arbitrage small, and being cautious makes a lot of sense. There are those I know who just trade pre earnings both long and short certain names, This would be a pretty low correlation type of trade so “arbitrage” when market isn’t vulnerable to sudden credit contraction and rising LIBOR rates isn’t the only way to have a near 0 correlation, it’s just the one I am going with. Earnings has larger moves in a short period of time and may require greater number of trades at a smaller position size to reduce potential for a large downside swing in portfolio size. What I am trying to communicate here are the PRINCIPALS though…

You can use the trends, or use value weighting or whatever signal you want for adding lower and selling higher via rebalancing, or more aggressively repositioning your allocations. But A very often overlooked goal is how your overall return on risk within a portfolio comes out. And to do that, it requires multiple assets with low correlation weighted towards which ones have a higher probability of equal upside/downside or greater overall edge, and a focus on low correlation. Once you can accomplish that, you can determine your return based upon leverage and how aggressively you position one way or another.

I have another post I will work on that further illustrates this difference in leveraging up your returns vs no leverage given everything else is roughly the same.

Comments »