iBankCoin
Home / Excel Spreadsheet Wizardry (page 2)

Excel Spreadsheet Wizardry

How A Portfolio “Kill Switch” Can Change Everything About Long Term Expectations

We all most likely have some sort of psychological breaking point in which we would give up on the system, or in which we should probably re-examine our strategies, and in some cases, in which people go crazy and “break” to the point where they start revenge trading and no longer are actually trading their system. The prior risk management modeling I’ve done using a spreadsheet has not taken into account fees or how one handles draw downs. I have modified the spreadsheet such that there WILL be a fixed fee involved with trading (thus if you have a significant drawdown fees play a much bigger role as a percentage of your account), and I have added the ability to add a “kill switch”. Since I added fees at minimum, it’s necessary to have at least a kill switch of 100% (loss) so you don’t go on calculating $12 fees when your account is less than $12 and continue to go negative. In the meantime I set it up for 1000 hypothetical trades since we now have a more practical model I can simulate it for much longer time periods if need be.

So my hypothesis is people will give up after a drawdown of varying amounts. This drawdown is from the account HIGHS, not from the starting amount. Thus, for some people the end result after 1000 trading periods (whether they participate in all 1000 using the given strategy or not) will actually sometimes be better if they risk less to avoid this breaking point.

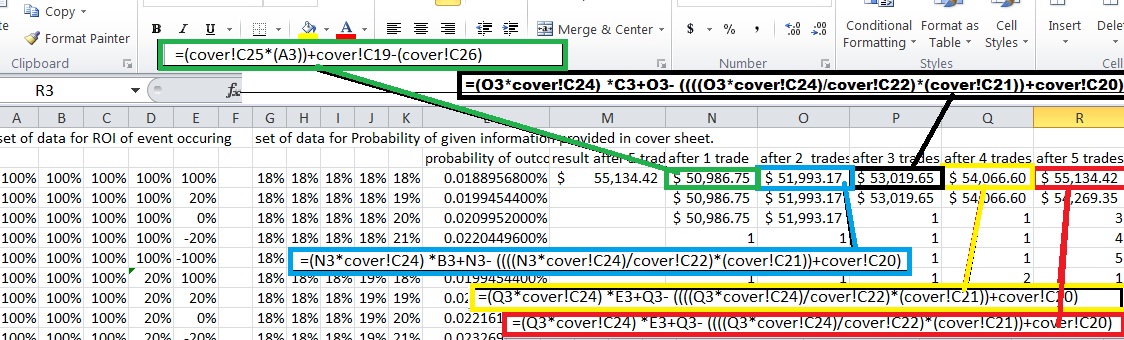
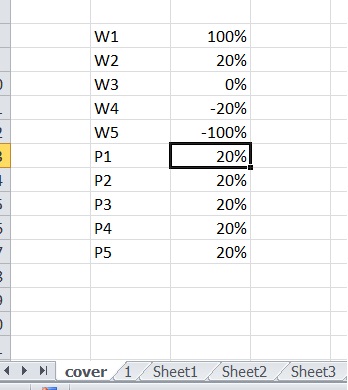
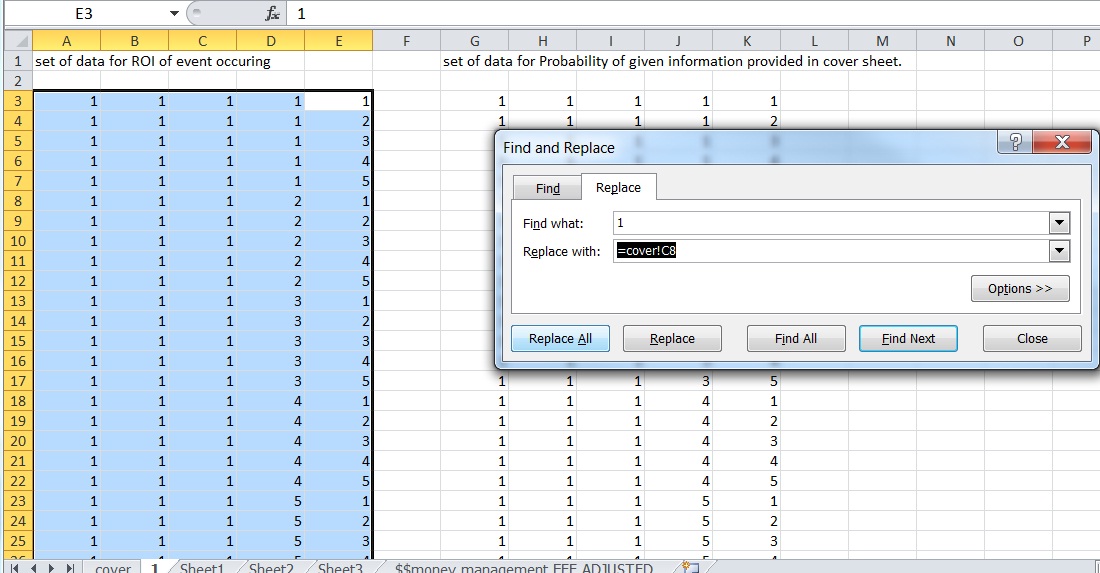
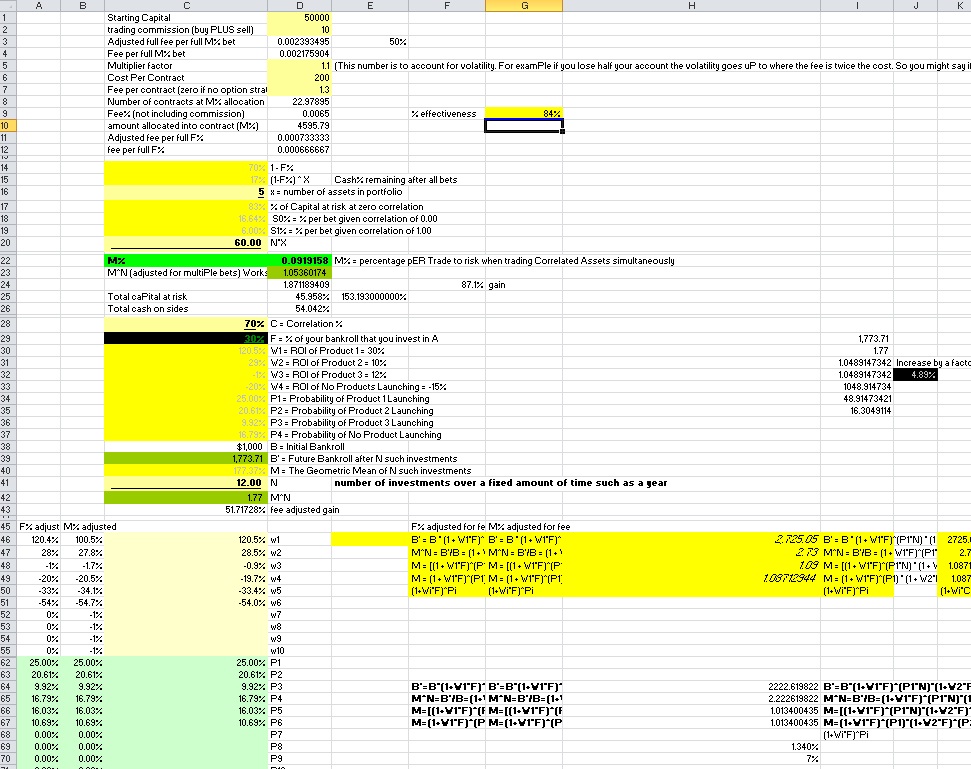
PLEASE understand that this simulator only uses one trade at a time as if you only play a single OTM option trade at a time and hold no trades simultaneously. In reality having more relatively uncorrelated trades at a smaller risk % per trade can often improve results at less risk, especially if you have multiple systems such as profitable investing and trading stocks and other asset classes in combination with your options. I will get around to testing partially correlated trades simultaneously and possibly entirely different systems in the future. For now the expectancy is based upon

p1 17%
p2 20%
p3 16%
p4 23%
p5 24%
w1 294%
w2 52%
w3 0%
w4 -64%
w5 -100%

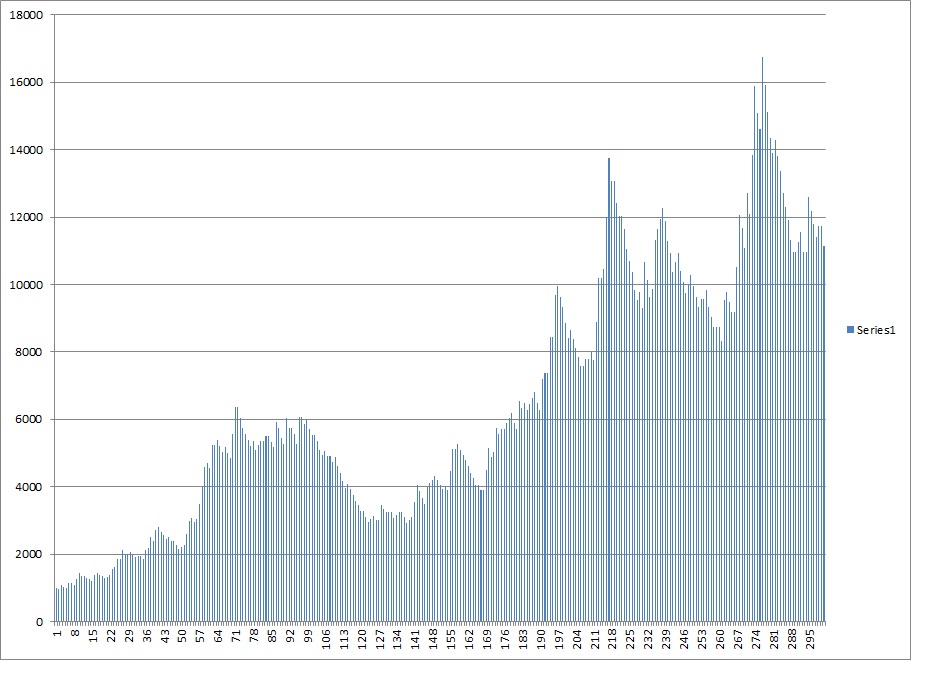
My 2013 OTM option trading results at various risk levels and various kill switches to see a distribution of simulated results. For all accounts I will use a $10,000 starting portfolio and $12 for completed transaction (buy fee plus sell fee) just to use round numbers and so that fees is somewhat significant to the equation.

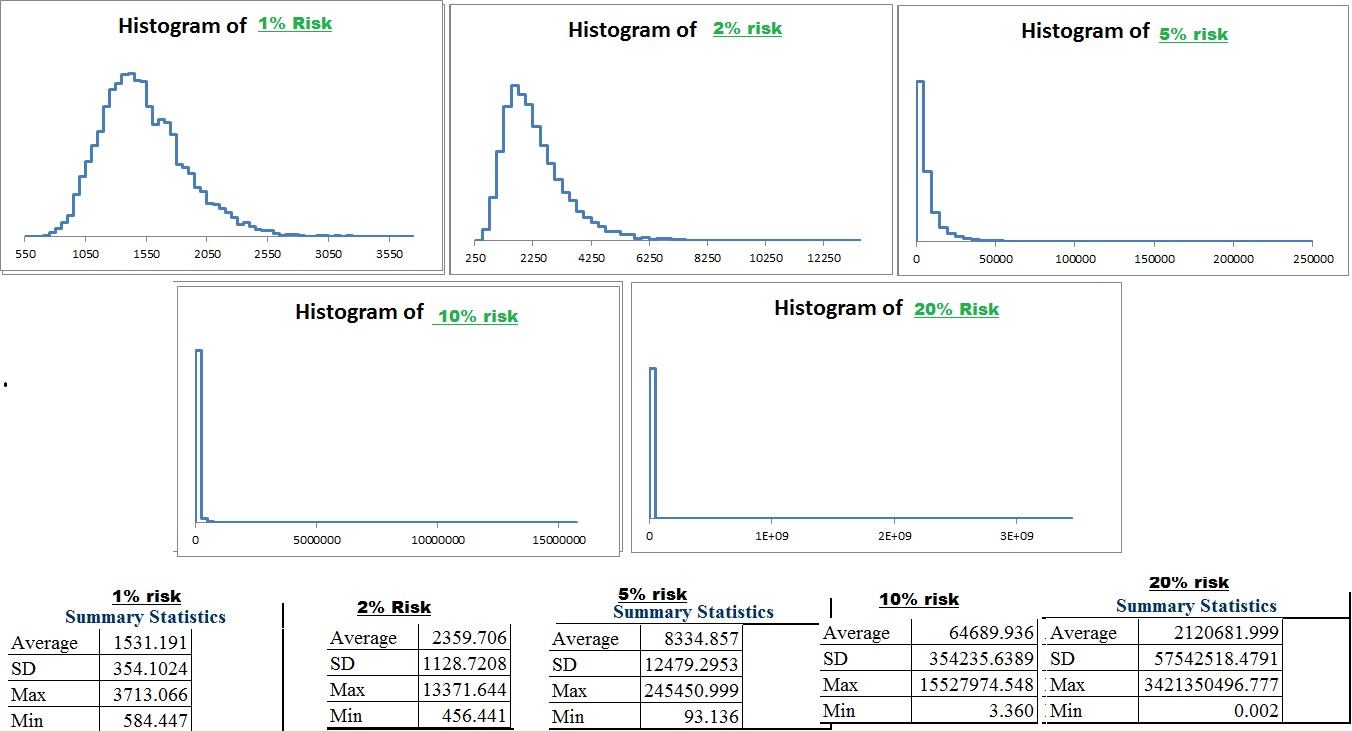
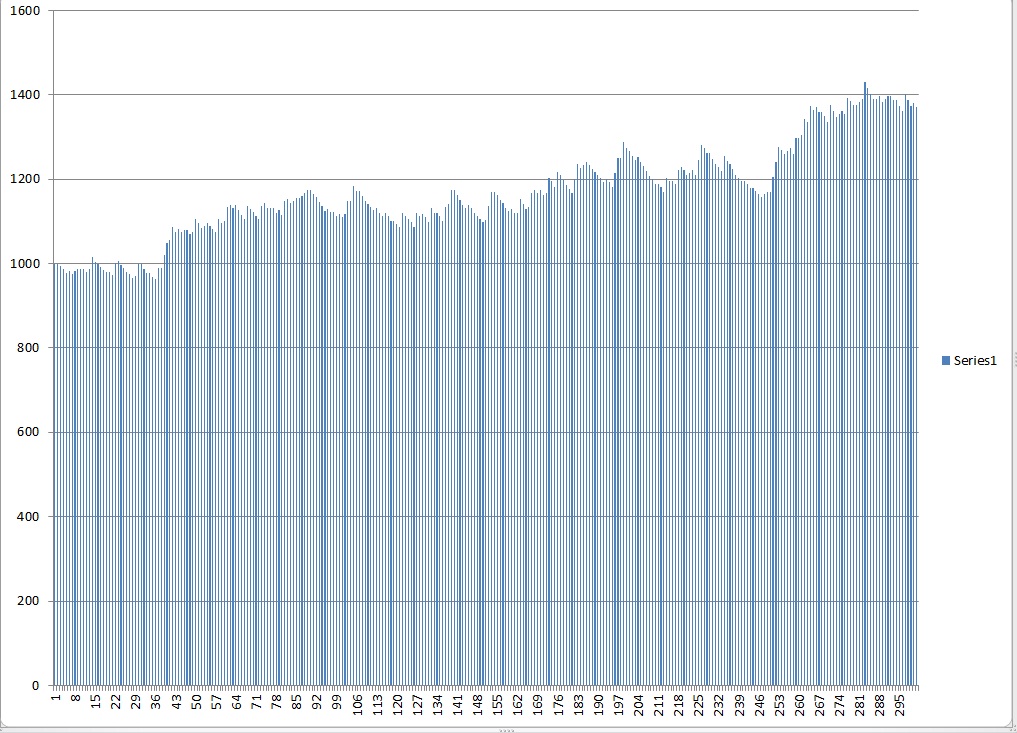
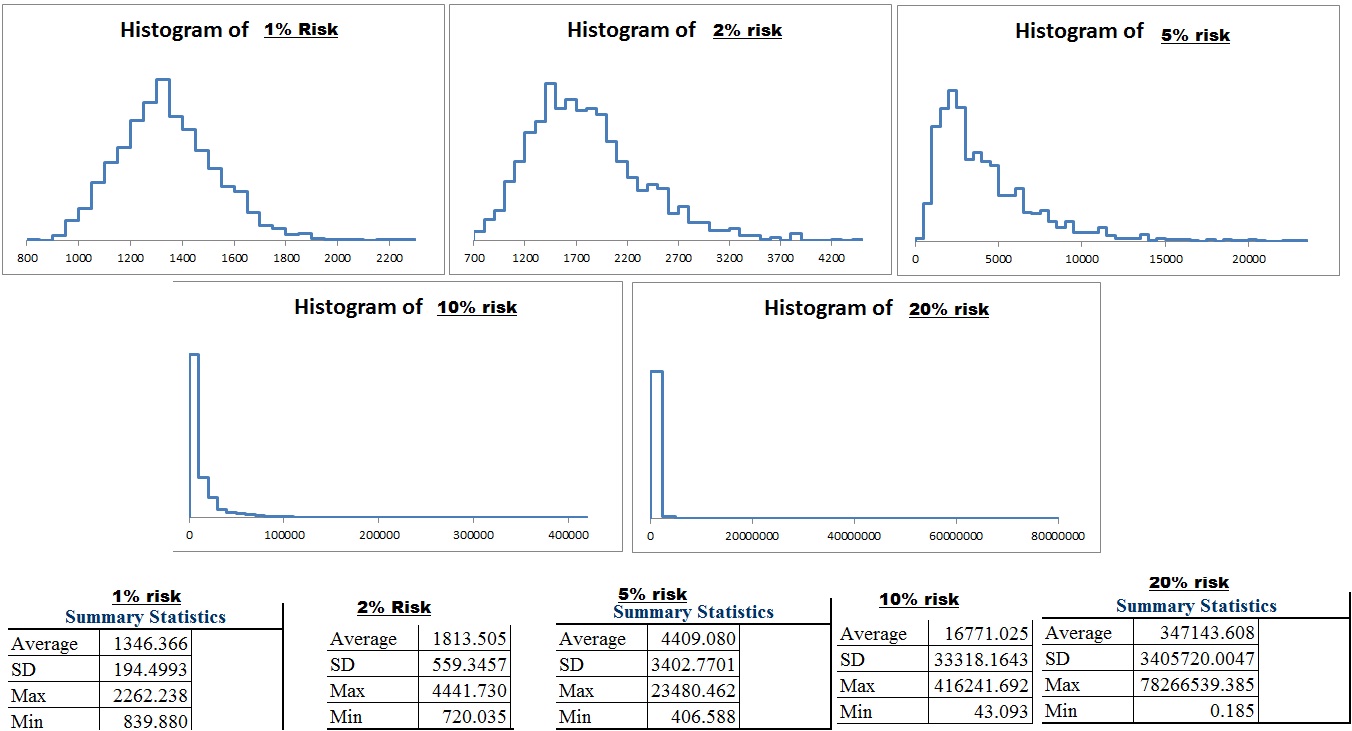
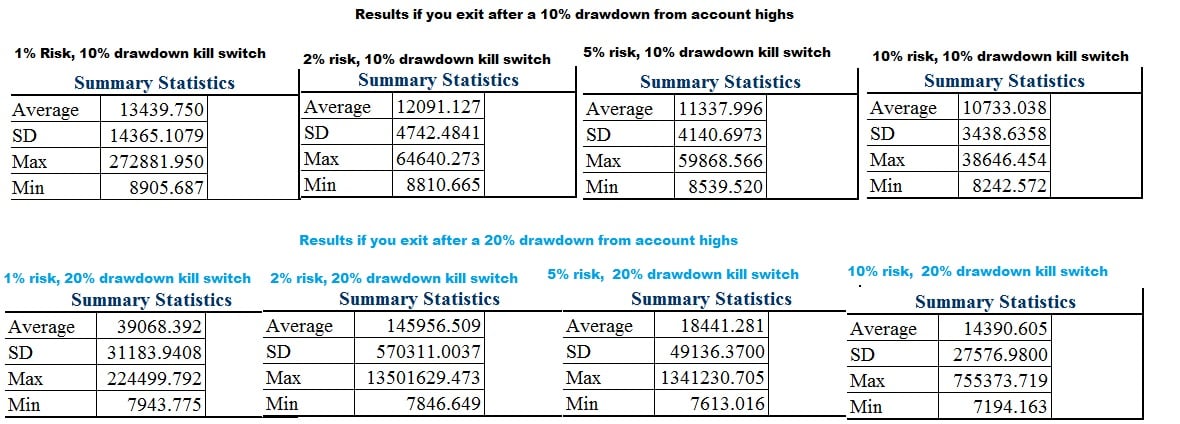
First let’s start with someone who is very risk averse and cannot handle even a 5% drawdown without feeling incredibly nervous and emotional and plans to quit at a 10%.

I had to think about the results and double check them at first, because I was surprisingly getting a significant skew right with only 1% risk.The mean is greater than the median. (i.e. the “average” is skewed by a smaller number of outliers such that the majority of the people are actually below the “mean”)

The reason was that at 1% with a 10% drawdown, you not only have too little capital at risk to the point where fees will eat away and a large percentage won’t get off the ground, but also that it is extremely common that at some point within the first 200 trades of those 1000 that you will hit the kill switch and very few will make it through all 1000 to produce significant gains which on average will be pretty high even with 1% risk (given that you can last that long). The overall average was still above the starting amount of $10,000, but in most cases, the fear of drawing down killed the traders hope of making money and taking risk. Increasing beyond 1% actually reduced average results because more risk = more volatility and greater probability that you will drawdown before giving your system a chance to compound it’s gains. 10% in theory is around “optimal” in terms of maximizing geometric return, but to someone who is risk adverse, it is probably less than 1%.

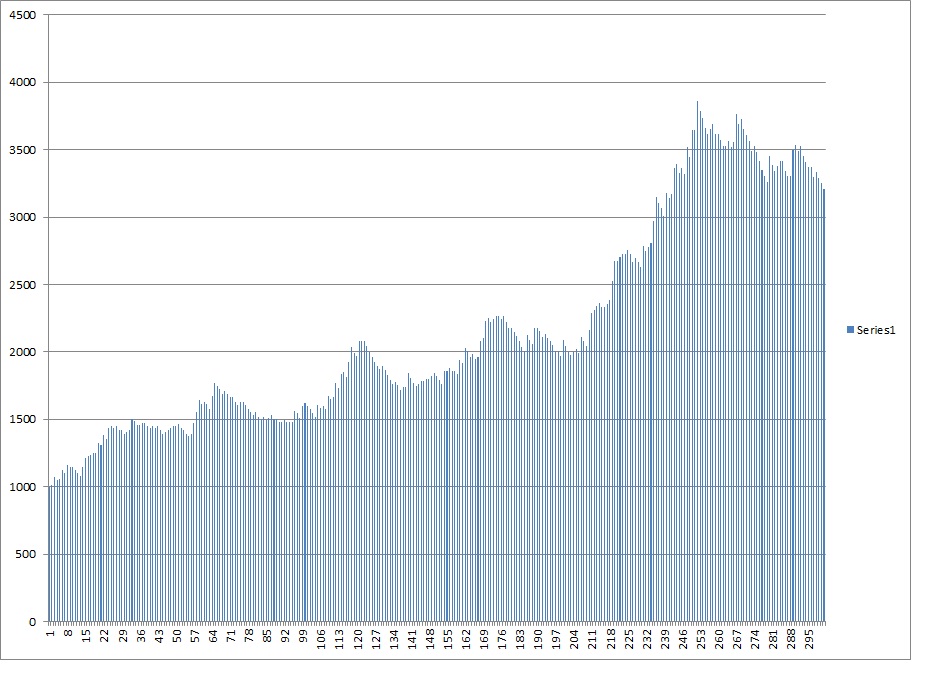
I then decided someone who is mildly risk adverse and doesn’t like 10% drawdowns, really starts to go crazy after 15% and ultimately feels compelled to shut down the account after a 20% drawdown. This was interesting because the average ending amount really increased from 1% to 2% but then decreased to from 2% to 5% to the point where you are better off risking 1% than 5% if you can’t handle a 20% drawdown.

I didn’t gather the histograms yet but here are the data points for 1000 monte carlo simulations of 1000 trades under each given condition.

drawdown switch 10p and 20p

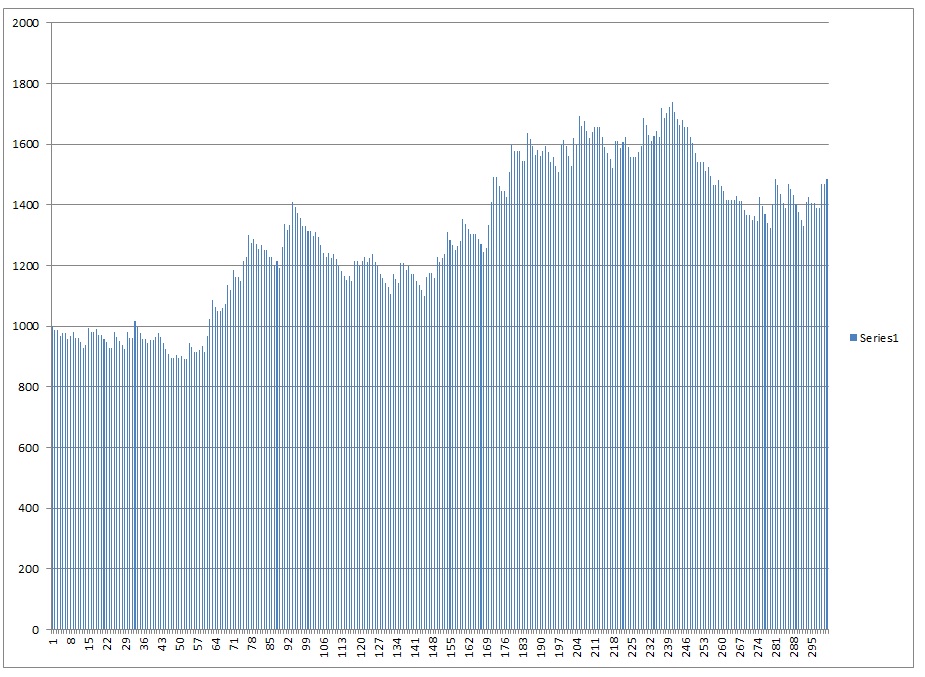
30% and 40% drawdown was up next.

drawdown switch 30p and 40p


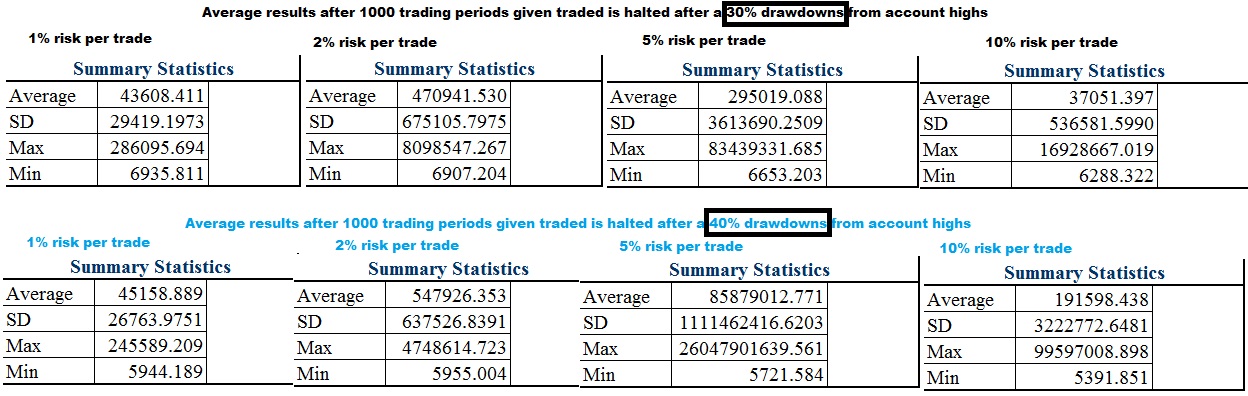
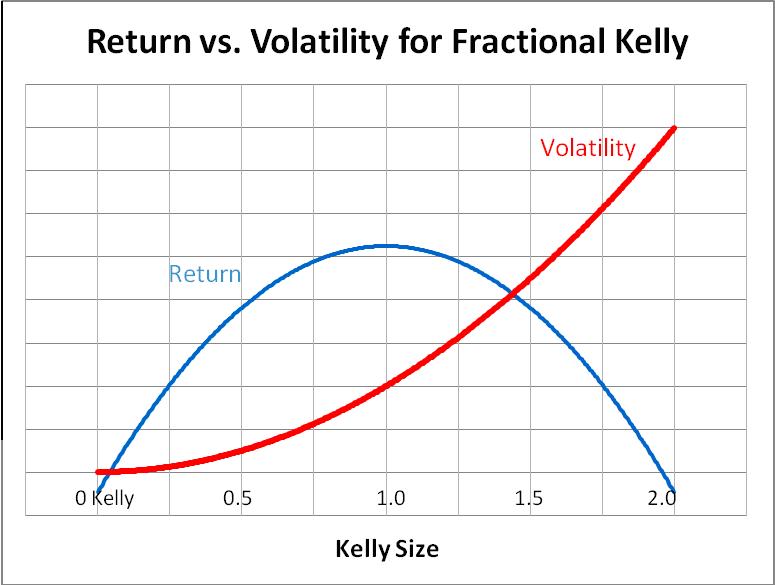
As you increase risk and become more lax on the “kill switch”, the worst case scenario gets worse, but so does the best case scenario. The skew actually becomes less noticable with a larger drawdown switch AND less risk per trade. Over the long run if you LET the trading system work, the results begin to normalize and cluster around the average. However increased risk increases the skew and depending on the drawdown kill switch may not improve even the MEAN average results. With these trades the approximate kelly criterion is 15% of capital but with even the risk aversion to withstand a 30% drawdown from high you are still best risking less than 1/3rd of the kelly.


So that brings us back to the kelly criterion graph which is entirely misleading if you are not aware of the other variables including personal aversion to risk, sample size, time period, etc. This graph is with the assumption of infinite time on your side because it was mathematically convenient. However, based upon some understanding of real data in a finite number of time given certain psychological barriers one has to cross among other things you know that for practical application even risking 1/3rd of this amount is incredibly aggressive when using an option based market strategy assuming one single uncorrelated bet at a time. We are also assuming KNOWN information and a fixed edge as opposed to a more uncertain one, both of which favor more caution. On the other hand, I believe I left a lot of money on the table and can improve my system by executing it and managing it more efficiently, and that eventually I will get around to testing how multiple trading systems work on the account. My theory is you can reduce risk and increase return by using complimentary systems (a stable consistent risk adverse system combined with an aggressive one both of which are relatively uncorrelated with the right mixture will compliment each other and both improve return and reduce risk while “normalizing the returns” over a finite number of time)


Hopefully this post is enlightening and helps you really analyze and understand risk, and I look forward to advancing my spreadsheet in the future to help me more thoroughly analyze a more multi-dimentional (synergistic) approach to risk.

Comments »

Modeling Your Past Trading Results At Different Risk Levels

So In the last few post I have really focused in on objectively modeling risk within a portfolio given a particular system. Before I go and amend the heck out of the spreadsheet to upgrade it to include the possible input of fees, of monthly addition of new capital to combat some of the decay, adding a “kill switch” input/function where the results are automatically capped at a particular loss if you draw down below a certain amount of your initial risk, and possible other features at some point I may add, I wanted to actually use it as is using objective numbers rather than an arbitrary 20% probability of a particular result with a set expectation.

So I have set up all my trading results not including open positions over 2013 using options while setting stock trades aside separately. I chose to include hedges in the calculation. I did not update a few trades including my 1200% gain in twitter calls. Here are how I looked at the results. I had 281 closed trades since I started tracking. I have room for 5 inputs of theoretical “results” so how I break this down may create a slight difference from reality and theory here, but this is just a model. I want to keep all 100% losses together separately. I have 71 trades that expired worthless. That is 71/281=~25.267%. That is better than I thought I would get because of the aggressiveness of the options.

Now, I want to take a few slightly better than break even and slightly worse that average zero%. I basically took any option trade that made between -18 to 18% and got 33 trades that effectively equal a scratch 33/281=~11.744%

Then I want to average all of the remaining losses not included in the “scratch” area. These most likely will be premium that I salvaged to avoid the 100% loss and those nearing expiration that had failed to move enough.. The average loss here is ~63.8143% and there were 74 trades in this category 74/281=~26.3345% The actual expectation was positive but less than 1% but I will round down to 0%

Now the WINS. Any win over 100% deserves its own category. There are 43 of these 43/281=~15.3025% of all trades with average ROI of ~293.0585%.

And the remaining WINS. These were most likely trades that either I managed poorly and took off before it reached my target, or ones in which I sold and/or rolled out as expiration forced the issue. There are 60 of these 60/281=~21.3523% for an average ROI of ~53.87795%.

So… Now we can define our system. I like to list the GAINS from highest to lowest for easy and consistent interpretation when I look at other systems or modify the expectations.
This is one way to show what the system looks like.
P1=.153025
P2=.213523
P3=.117438
P4=.263345
P5=.252669

W1=2.930585
W2=.5387795
W3=0.000000
W4=-.638143
W5=-1.00000

We confirm that the probabilities are correct because these all add up to one. 37% of my trades produce a win, 48% win or approximately break even. But the largest gains clearly outweigh the losses.

The old way I used to do things would plug this in a kelly criterion calculator, find out that a full kelly I could risk 10% per trade if traded a single trade at a time, and then use my own calculator that factored in fees and correlation and multiple bets at the same time and fees and based upon a $10,000 account would conclude that the “optimal” number of trades at a 60% combined correlation would be 14 trades at 2.6% risk per trade for total of 36.4% capital at risk. Then I would curb that to aim for maybe 7 trades at 2% each.

But now I have learned that 10% resembles more of a “lotto ticket” even after 300 trades. But, I have my baseline of 10% as the max and can make an entirely new distribution at 1% 2% 5% and 10% to show you the difference between this system and one with a 20% probability of either 150% 50% 0% -50% or -100%.
First let us redisplay the results from the arbitrarily determined system
results

Now that we have real numbers, I want to be a bit more thorough than just using 1000 simulations. I will bump it up to 10,000 simulations per risk level. I will leave it at 1,000 just so the numbers remain the same. Keep in mind that the kelly criterion for my trades in reality is 10% vs the theoretical system is 14% so 1% risk actually is MORE aggressive with my system than the theoretical one. As a result you should expect a higher standard deviation and a higher average. With a larger simulation alone you will get a larger minimum and a larger maximum as well anyways.

And here is what the histograms and data looks like

resultme

I think more telling than the distribution since it is so difficult to see at what level the large decline really starts when you deal with such large numbers is the sample equity curves. So I will run a few of those. Click here to look at the equity curve of the theoretical model. and here are a few sample equity curves modeled after my trading abilities.


1%

1p risk

2%

2p risk

2p risk2

5%

5p risk

AND half a dozen examples of 10% risk and the vicious account volatility

10p6 10p5 10p4 10p 3 10p2 10p risk

It’s important to understand that 10 simultaneous trades at 1% functions much differently than 1 trade at 10% or 10 trades over 10 trading periods at 1%. Unfortunately it isn’t so easy to model this and the results depend greatly upon how correlated the trades end up being (the lower, the better provided you can do so while still having the system be as profitable). For informational purposes, assuming no fees, you will see 10 simultaneous trades at 1% each function as a cross between 1 trade over 10 trading periods and 10% as you get some of the low risk volatility benefits of small position size and some of the high return benefits of 10% risk. The result is usually a better return per risk.

Going forward, I am working on improving this simulator so that it can allow for additional inputs that will help test how fees, adding capital, multiple simultaneously partially correlated bets and having “complimentary systems” can potentially positively influence return while also reducing risk.

Comments »

How I Let Data Guide My Conclusions and Results Of Thousands Of Monte Carlo Simulated Trades!

I stand to you today to announce that I have used data and simulation to prove myself wrong. Call me a flip flopper if you like, but I view this as a constructive thing as I have chosen to take the most profitable and beneficial path rather than the most comfortable. While some remain attached to certain ideas, I let the data guide my conclusion whenever possible. The human mind is full of biases and often too rigid on our ideas. Be open to examining the assumptions that you take for granted on a daily basis just as testing the assumption that “the world was flat” was a productive one, it is possible you may make significantly greater progress than all of those around you who resist the change in your ideas.

My previous paradigm was guided by this understanding of the relationship of risk:
kellycriterion
Unfortunately, every model has certain “assumptions” it must make to construct any particular generalized “model”. It is usually not the model itself you should test, but the assumptions within the model, as well as your own personal assumptions which can only be done by data first. After adjusting and testing these assumptions and thinking more dynamically I can see that this is simply not practical as you will also see in a bit.

At first I had a simulator created to calculate all possible permutations of theoretical trades, but realized the simulator could be improved. Rather than continuing down the direction I was headed, I “flip-flopped” again, instead opting for constant improvement. I instead came up with a spreadsheet that uses the random number generator and a “Monte Carlo simulator” plugin that I view as much more efficient and flexible in terms of the duration of trades in which I want to test. Although it lacks the same degree of precision, it is a productive tradeoff as you can still increase precision in exchange for a more timely monte carlo simulation (with more random iterations).

I used the spreadsheet to look at returns dynamically over a finite amount of time such as 300 trades. Out of a thousand traders for example, some percentage may gain 20% while another percentage gains 100% and another percentage loses 50%. Using this data, A histogram plotting all simulated results of each of the thousand random iterations of 300 trades was made for various levels of risk given a particular system. The simulation allows for a change of any one of these inputs (probability of 5 different “results” of the trade, the ROI given each of these 5 “results” the number of traders randomly selected and the number of trades they make). You can even look through random equity curves across all 300 trades at a given risk factor and refresh it with a push of a button to pull up another random trader to get a better sense of drawdown within different points of the system over the course of those 300 trades.

Without further ado, here are some results!


results

pX=probability of event X.

wX=win % (ROI) given event X.

System: p1-5=20% W1=150% W2=50% w3=0% w4=-50% w5=-100% A winning system is presented.

Risk defined as capital at risk since this is an option strategy and you can lose the entire premium.

“optimal F % / full kelly = 14% risk”

Note the severe skew right. This means as you increase risk extreme outliers begin to skew the average higher than what is “typical”. Skew right means the mean (average) is way higher than the median (average). The “worst case scenario” grows with risk. The probability that you end with a lower than average result (that is not a typo) increases as risk increases risk given a finite amount of time. Eventually the probability of a poor result is so great that as you increase risk the long term geometric return suffers. If you are a true cowboy looking to become an “outlier” and willing to put in the risk, then perhaps that is okay with you, but just know that going beyond the “optimal” amount is destructive as you approach “an infinite number of trades”. Just know the type of CRAZY account volatility you will have to endure, and a large probability that you actually will end down even after 300 trades. That’s almost 6 years at 1 trade a week!

Since I took the time to create this spreadsheet, I can simulate thousands, or if I like, tens of thousands of traders trading anywhere from 1 to 300 trades (or more if I take 5 minutes to set up more) with a given system with a push of the button. I can instantly adjust the expectations of the trading system and see how the results change.

In the next post Titled “Equity Curve of Risk – How Risk Influences Expectations” I show some example equity curve of a particular risk percentages.


Comments »

Setting Up The Calculations

This is an ongoing series on how to construct and implement a position sizing spreadsheet to help you optimize the money management aspect of your strategy. It will be capable of helping you maximize things such as probability of reaching a certain return in a year, or probability of reaching a certain percentage return or capital amount by a certain deadline, or minimizing your chances of ending up down a certain amount over X trades. This will help you to trade more consistent with your goals and come up with more realistic expectations.

Part 1 WoodShedder Time! Creating A Quantifiable Approach To Position Sizing

Part 2 Building A “Position System Simulator”

Part 3 Building Cover Sheet, Determining Probability of Results (Position Size Simulator Part 2)

Part 4 Adding To The Cover Sheet

Part 5: Setting Up The Calculations

As stated in the past, I want to create a spreadsheet that simulates all possible combinations of results with a given “weight” according to the probability of each result happening.

Formulas are the “engine” behind this spreadsheet. If you want to know the probability of a 20% drawdown over a series of 5 trades or 25 trades, or the probability of any result over X trades… you have to have formulas that can calculate that, given certain data.

The cover sheet gives us a “starting bankroll” and % of capital used per trade and the data that we can set up. We want to use this data plus the data for the “fees” in the cover sheet and the ROI on the calculation sheet to determine the result of a set of 5 trades and repeat for each possible combination of 5 trades. We will start with 1 single trade.

To set up this formula to solve for all, we must use the cover sheet. Lets come up with the formula AFTER fees for trade 1.

(Starting Bankroll * bet size*ROI of trade 1)=return in dollar amount after one trade before fees

+ Bankroll= bankroll in dollar amount after one trade before fees.

– ((# of contracts*fee per contract)+Commission per trade) = bankroll after 1 trade (fees included).

We can clean this up a little and simplify this to:

Bankroll after 1 trade=(Starting CAPITAL towards trade * ROI1)+Bankroll – (fees).

We just need to run the calculation on the cover sheet for FEES and “Starting Capital towards trade”. This will require less switching back and forth between tabs and make the what formula is accomplishing once we run it on the spreadsheet less confusing.

Now trade 2. We will be left with a different amount of capital from trade 1, and use a different bet size in dollar amount. So now we must use the formula:

$ at risk * ROI  + Bankroll – Fees

But $ at risk depends on CURRENT bankroll times bet size and CURRENT bankroll is based upon what we just calculated. Additionally FEES depends upon # of contracts which depends on current bet size.

so $ at risk is replaced by

(previous bankroll * bet size % )

And Fees is replaced with

((# of contracts) * (fee per contract))+ commission

(# of contracts) is then replaced with

(Current Bankroll * bet size %)/option price (we won’t round and will assume fractional contracts. In real life your bet size and results will vary as a result depending on how you choose to round).

The complete formula is thus

Bankroll after trade 2=(Previous Bankroll * bet size) * ROI + Bankroll – ((((Current Bankroll * bet size %)/option price)*(fee per contract)) + commission)

Bankroll after trade 3,4,5 is actually the same so we can replace the 2 with X.

The 3rd, 4th, and 5th trade is simply the same formula, only adjusting “current bankroll” to reflect the results of the bankroll after the previous and most recent trade.

So now we simply convert it into “excel language” we want to substitute each aspect of the formula with the corresponding cell on the sheet or on the cover sheet that corresponds with that particular data set.

Then we will want to use an easy feature to make sure that formula is applied in a similar manner for ALL relevant cells, rather than just one.

 Setting up the formulas:

What may make things easier, is if you just copy and paste the formula in it’s current form, and then use a find and replace function to replace the text “Previous Bankroll ” by “N3” or whatever corresponds to the cell which contains the bankroll after the completion of the first trade. Or in the case of the first formula for the first trade, replace “Starting Bankroll” with “cover!C19”. There is one problem with that as the “previous bankroll” for each row of cells will be different, as they will correspond to different potential ROIs. We will get to adjusting for this in a bit so you can apply the formula to all cells For now I am just going to list the formula according to the way I have set up the spreadsheet.

Bankroll after 1 trade=(Starting CAPITAL towards trade * ROI1)+Bankroll – (fees)

Translates into the excel notation:

=(cover!C25*A3)+cover!C19-(cover!C26)

The only variable you will want changing for the entire column (in this case the “N” column), is A3. For row 3 it’s A3, for row 4 it’s A4, etc. A3 corresponds to the ROI for that set of trades and this will occasionally be different.

The formula for the remaining trades are

Bankroll after trade X=(Previous Bankroll * bet size) * ROI + Bankroll – ((((Current Bankroll * bet size %)/option price)*(fee per contract)) + commission)

That translates into trade 2 cell has formula

=(N3*cover!C24) *B3+N3- ((((N3*cover!C24)/cover!C22)*(cover!C21))+cover!C20)

trade 3

=(O3*cover!C24) *C3+O3- ((((O3*cover!C24)/cover!C22)*(cover!C21))+cover!C20)

Trade 4

=(P3*cover!C24) *D3+P3- ((((P3*cover!C24)/cover!C22)*(cover!C21))+cover!C20)

Trade 5

=(Q3*cover!C24) *E3+Q3- ((((Q3*cover!C24)/cover!C22)*(cover!C21))+cover!C20)

Illustration with all formulas included for people that are more visual (every formulas added in over image for clarification).

formulas


That gives us the outcome after 5 trades given ONE single set of 5 trade combinations. There are over 3,000. There is no way we will do this all manually.

Now, the only thing that really changes as we set the formulas up for all possible trades is the number after A for trade 1, numbers after N and B for trade 2, numbers after O and C for trade 3, P and D for trade 4 and Q and E for trade 5. The numbers must change to correspond to the row where as everything else will remain the same.

If you click and drag the formula, it changes ALL numbers, rather than just the ones you want.

There probably is an easier way than the way I will suggest, so if anyone is an excel guru and knows it, I would like to hear it, but this is what I do…

Set up a separate sheet that basically isolates the component of the formula that you want to change from the one’s you want to keep the same. Keep the equal sign separate so it doesn’t try to calculate anything or autoadjust the formulas.

In the first trade we only need to adjust 1 number after A. So copy each column and hit CTRL+SHIFT+Down Arrow to select all and then CTRL+V to paste. For the next column you can just double click on the bottom right hand corner of the cell to autocopy and paste all the way down until the last row that was used. However, the column you want to modify you must adjust the formula first. In this case, we want each formula to contain 1 number larger than the previous so we use the formula =C2+1 and excel will run that formula for all cells down the entire column.

changeformula


It will do this and then eventually fill in with numbers.

Now we have to bring the formula back together so we can paste it back into excel on the tab we want to. So we need to copy and paste all the formulas we want to use into a notepad (so page down and highlight about 3200 rows or more and then use CTRL+C to copy, and open a notepad then press CTRL+V to paste)

The issue at this point is that between those cells it automatically created a “tab” over or a separation between the formulas, so highlight the spaces and copy them and do a find and replace to replace the spaces with… nothing(leave the replace blank).

findandreplace

Replace all!

Then copy and paste this BACK into the excel spreadsheet so you can put in all the formulascoversheetreplace1


Repeat for all rows. The easy thing is, the find and replace for after trade 2 and after trade 3 is incredibly similar. You can simply change a couple letters in each formula on the sheet and double click the corner box to copy and paste down the row rather than re enter in the entire formula and isolating each component after setting it up for row 2 and 3 and 4 and 5. One bit of advice, separate the equals sign, plus sign and minus sign in it’s own cell, otherwise it will try to run a formula and change it to contain an equal sign.

This should only take about 5 minutes to get all of the formulas set up in this manner.

Now what do we have? We have the RESULT after 5 trades for every possible trade, and we have the probabilities of each event occurring. We are real close to finishing this up.

We will wrap it up by a few post that sets up a formula to weight each event by a probability of occurrence and adding a weighted average and then using a formula, apply this and expanding it to 125 trades, rather than just 5 and our work will be mostly complete. I may add a “bonus” section of this series to clean up the data and give us conclusions right on the cover sheet automatically and other features that may be useful to add. I would like to adjust this to come up with a spreadsheet that allows you to consider making multiple trades, rather than just one if I can figure out how.

But as mentioned previously, at some point I want to get into discussing my philosophy as well, and converting that to a dynamic strategy, which is currently in development.


Comments »

Adding To The Cover Sheet

Part 1 WoodShedder Time! Creating A Quantifiable Approach To Position Sizing

Part 2 Building A “Position System Simulator”

Part 3 Building Cover Sheet, Determining Probability of Results

Part 4 Adding To The Cover Sheet

Part 5: Setting Up The Calculations

It’s been awhile since I discussed my position size simulator or worked on it. Since it’s not as fresh in my mind, and I’ve been lacking in the sleep department, I am going to keep this post brief as I get back into the groove and do more writing about it than actual action.

coversheet


This is what it looks like after I have added some variables. The highlighted yellow on the side for W1-W5,P1-P5 is just pulling data from another sheet if I want I can enter it in. Very simple calculations to determine the number of shares/contracts you can buy given the % capital per trade and starting account size. Very simple calculation on $ of capital towards trade. % of capital per trade times starting account size=$ of capital towards trade. $ of capital towards trade divided by share price or option price (for each full contract of 100) equals number of shares or contracts.


So set this up.

With this, we will be able to pull data and run calculations and ultimately determine based upon every individual possible combination that the 5 trades can go (based upon our given parameters of 5 possible outcomes per trade) what the amount of capital we will have after 5 trades based upon the position size and information given.

From there I believe we will be able to aggregate all the data and weight according to probability of each event happening, and then determine the probability of reaching certain criteria after 5 trades. Really we will have all the information we need to determine after X trades (multiple of 5) what the probability of certain criteria would be.

For example, the odds of 5 losses in a row can help determine the probability of 10 in a row by multiplying the odds. The odds of 10 “wins” in a row can be determined in a similar manner. If we have a duration of “trading career” that lasts say 150 trade periods (of one trade only unless we make significant adjustments), then you can determine what pace per 5 trades return you need to reach a certain goal and determine the percentage of series of 5 trades that are OVER that amount at a given bet percentage. And you can either maximize your probability of reaching that goal… Minimize your probability of getting a particular loss threshold… or a combination of achieving a minimum probability of reaching a certain threshold or more while still also limiting the probability of a particular 5trade long draw down to being under a certain threshold as well.

It’s important that you also understand the assumptions that this makes. It assumes that the data given is a correct accurate assessment. It also assumes that you have the psychological disposition to stick with the same system/bet size throughout many potential loss streaks you may run into. It also assumes you trade the system as effectively as the numbers dictate.

In reality, I think you can be reasonably confident that a strong possibility of it being a slightly “fatter tail” and fractal market and all that black swan stuff exists, but you still have a certain confidence that the data won’t deviate too strongly and I think you can still manage your risk and adapt your system as the feedback changes.

Some change systems based upon market conditions. That provides a better quality of sample size when evaluating systems, but to me is done on a lagging basis and won’t have a huge advantage since you are chasing the system that works in the given conditions, rather than anticipating it. Instead one might have capital allocated into trading different systems based upon the assessed probability of seeing that particular market type in the future.

At some point I want to get into an approach to the market I am developing that I consider most appropriate. But first I still will have to work on calculations that pull FROM this cover sheet for all the possible combinations of 5 trades. Then I will set about a sheet for a series of these 5 trades and a series of those 25 trades to construct expectations based upon 125 trades.

The next post will begin to set up the calculations sheet, which will do the bulk of the work.

Comments »

Building Cover Sheet, Determining Probability of Results

Part 1 WoodShedder Time! Creating A Quantifiable Approach To Position Sizing

Part 2 Building A “Position System Simulator”

Part 3 Building Cover Sheet, Determining Probability of Results

Part 4 Adding To The Cover Sheet

Part 5: Setting Up The Calculations
In this part, we will go over as the title suggests, building a cover sheet. Ultimately this will summarize all the data on one sheet so it will be the only sheet we need to look at and adjust. We will then set up a formula to help us to determine the probability of each individual possible outcome of the 5 trades we have set up. Once you have all the possible combination of outcomes plotted from the first part, it’s time to begin to build a “cover sheet”.

The cover sheet will have all the “adjustments” made to the system on it. For example, you basically list how you manage your trade and the probabilities. W stands for your “win ratio” or your edge or ROI

w1 -20%
w2 -10%
w3 0%
W4 10%
W5 20%

This would signal that your system either takes a 10% loss or 20% loss and targets a 10% gain or 20% gain. The next portion assigns probability to that system.

P1 10%
P2 25%
P3 20%
P4 25%
P5 20%

Would indicate that you have a 10% chance of hitting your 20% loss, a 25% chance of hitting a 10% loss, a 20% of scratching out for an average of no gain, a 25% chance of a 10% profit and a 20% chance of a 20% profit.

So you make a cover sheet that for starters can be real simple and look something like this. It really doesn’t matter at this point what the data is, you will adjust that for your system once it’s done.
cover

More will be added to this cover sheet later. The goal is to not have to look at any of the other sheets unless you are adding some other feature or modifying it. Once you are done, the cover sheet will be where you input the data AND give you all the information you need to draw any conclusions.

Now you can go back to your other sheet and use the “find and replace function” (CTRL+H) to replace each of the numbers generated with the corresponding data on the cover sheet. You don’t just want the data because then you have to redo the spreadsheet every time. Instead you want it to put a formula in place of each cell that will pull from the cover sheet. So you create a find and replace something like this.
findandreplace

In this particular example, I find and replace all cells with a “1” in them with =cover!C8 which pulls the data in the C8 cell (of the tab labeled “cover”) and puts it in place of each cell with a 1. The C8 cell, in this case, is the data corresponding to W1. Then repeat for each number. The 1-5 should correspond to W1-W5.

(Warning, you may need to rename the numbers first if one of the numbers in the formula you just created contains that particular number so you don’t end up changing it. Such as replacing the 1 with 11111, the 2 with 22222 and so on. This way if you have the formula as =cover!C10 and you find and replace the 1 it won’t change it to something like =cover!C=cover!C90. Also note that I had to highlight the cells I want to replace, otherwise it would have also replaced the ones next to it that are designated for P1-P5.)

Repeat for P1-P5 corresponding to the coversheet P1-P5.

setup1

Now we need to start with some sort of actual value and we will be able to see IF this scenario plays out what our portfolio will do. But that will be saved for another time. We also need to calculate the “probability” of that set of 5 trades in a row of occurring. With this information we will be able come up with things such as “probability of a return over X after 5 trades”. The idea is then to leverage that information to give us a probability of certain returns over 125 trades. I’m not yet sure what issues I will run into yet so one step at a time.

To get the probability of a particular individual event happening for each event, you simply multiply each of the cells dedicated towards probability or your “P1-P5” amounts together. Check your work by ensuring the sum of all these adds up to 100%.

probability

I am hoping that people by this point are starting to “get” what I am doing and trying to do a little more. It is sometimes a bit difficult understanding formatting, programming and mathematical concepts and then translating that to language and hoping the people reading actually get something out of it. I think it is a little easier to show you images like this. But I appreciate those who bear with me through this process.

Bet sizing and making sure your “system” AND bet size both work together to accomplish your goals and risk tolerance is of utmost importance.

At risk of sounding repetitive, in order to drill down what I am saying, I will continue to rephrase it…  one side of the equation is “what’s one possible “return” given a set of data (for all possible sets of returns over 5 trades)”. The other side of the equation is “what’s the probability of each return occurring given this set of data (over the course of 5 consecutive trades)”. Once you have that you will be able to “sum” up and “sort” the data so you can determine the probability of each given set of returns.

For example, after 5 returns you will sort the overall portfolio “outcome” which will ultimately be a portfolio SIZE or percentage gain on your overall “bankroll”. You then can sum up all the data ABOVE or equal to a certain outcome. You then SUM up the probability of each outcome to determine the probability that you achieve a certain pace of returns.

If your goal over 10 years is to reach a certain “retirement” number, and you place 12.5 trades per year on average, you simply need to solve the optimal bet size and system to maximize the probability that you get there in 10 years by looking at the data over 125 trades and adjusting things like the bet size or valuing entire systems by their probability of getting you to your goals. Or perhaps you just need to not have a 20% drawdown. Then you simply look at the probability of a 20% drawdown and MINIMIZE it. Or perhaps you want the BEST return that you can get with a less than 30% chance of ending down 20% after a year of trade, or without having a full year that ends 20% from the last anytime throughout the 10 years (125 trades).

The simulator will not create a system for you, but will give you comfort in knowing that if you can find reliable data, you can maximize chance of reaching retirement or minimize your chance of a 20% drawdown, or whatever your goals are.

But we are getting ahead of ourselves here since this is still under construction and you will have to continue reading this series to see how I build the spreadsheet to accomplish this task.

—————————————————————————————————————————————–

Before we jump into determining a “return” after 5 trades, the next thing that will be adjusted is “how much” to risk per trade. We will have to update the cover sheet to include things like “starting bankroll, fee per trade, % of capital allocated per trade. We will have to use that data to come up with a formula to come up with an “ending amount”, after the series of 5 trades, and have it calculated automatically for each row. But that will all be covered in the next post.

Comments »

Building A “Position System Simulator”

Okay, so lets get started in the quantifiable approach to position sizing. The intro sort of explained what I am trying to accomplish.

Part 1 WoodShedder Time! Creating A Quantifiable Approach To Position Sizing

Part 2 Building A “Position System Simulator

Part 3 Building Cover Sheet, Determining Probability of Results (Position Size Simulator Part 2)

Part 4 Adding To The Cover Sheet

Part 5: Setting Up The Calculations

The first step is to conceptualize how we are going to simulate a position size and what we are going to accomplish. I don’t want the typical “Monte Carlo simulation” where you have the data spit out a TON of series of trades using some sort of random number generator and determine the results based upon that randomness. I have found other people who have done that.

What I basically am looking for is a tool that will–given a set of basic expectations of the trade–determine the probability that at the given bet size that I will finish down 20% after 100 trades. I could just look at total draw-down perhaps within those 100 trades, but that may be a little more complex in determining all the possible combination of trades that draw down. We will see.

I may also want to know the probability that I draw-down 50%. I also will want to know the probability that I hit a certain “threshold” for gains as well such as 100% after 100 trades. The idea is I may want to find the bet size that maximizes my chances of reaching my “goal result” after 100 trades using a system (or 10 years at 100 trades per year or whatever) and by knowing the system, I can predict the time and also know the risks.

For some goal result could be what you need to walk away from trading. For others it could be the amount you need to reach to retire. For others, it might just mark a change in strategy to a more long term oriented approach or more passive index ETF based strategy. Or maybe it allows you to go buy that business franchise you wanted.

This to me is far more productive than “optimizing your overall maximum gain” which is insane. The Kelly Criterion, “optimal F” or other position sizing strategies often assume an infinite number of trades to weather the volatility storm. In reality those systems could give you a much worse chance of getting to where you want to be, and a far too high chance of having such a significant draw-down that it will take ages to even get back to even.

Some run a “Monte Carlo strategy” where it will simulate 50 trades or 500 trades with the click of a button, and then you can repeat that several times and each time you randomize, there is a different result. But I don’t like that because it doesn’t help me maximize anything, it just gives me a good idea of several possible results.

Instead I want to run all the permutations (possibilities) that a series of multiple trades can work out, and use the likelihood of each result and sum up the data that is beyond certain thresholds and determine an exact percentage chance of achieving that result.

Unfortunately, the number of cells available for computation on excel may make a large number of trades difficult. In the version of excel I use, there are 1,048,576 cell rows available. For just 10 trades involving 5 possible outcomes, you have 5^10=9,765,625 combinations of results. If we cut this to 4 possible outcomes we have exactly enough cells. 4^10=1,048,576

Determining probabilities and results after only 10 trades is not really all that valuable. Instead, I will have to have one spreadsheet give me the data for a group of say 5 trades, then use that data to group in chunks of 5 trades what can happen, and then 5 groups of 5 trades to produce 25 trades, and then 5 groups of 25 to produce 125 trades. This is good enough for me to give me the kind of picture I am looking for.

This way the formulas can give me data, I can quick determine new data, plug that in the next spreadsheet tab and then gather new data and input that into the final spreadsheet tab (or have it automatically pull to the next spreadsheet tab if set up right).

What I plan to do, is set aside a macros that will automatically list all permutations for say 5 trades that you could have a result by putting up a number 1 through 5 that corresponds to a certain result.

macros

As you can see the macros is running. It automatically spits out a number 1 through 5 and goes over all possible combinations of ways you can have a set of 5, 5 digit numbers. You can also see the formula that I set up in visual basics to run it. It was very difficult to get a screen shot of it midway through the process like this because it is very quick, but I did.

The next step is to copy and paste the data first directly next to the other data and THEN take that and copy and paste it into multiple sheets since there will be multiple groupings of 5 trades and the results of each of them. One of the sets of data is for the probability, the other is for the ROI given those sets of circumstances. You will see this done in a later post.

Then a find and replace function can be set up to replace each number with a formula that will pull from a “cover sheet” the data, as briefly mentioned  in the introduction.  [W1-W4, R1-R4, bet size]. I will then need to add another set of data that determines for each potential series of bets, a cash allocation percentage and what percentage into the system.

Eventually, my hope with the spreadsheet is that I can run the simulator for MULTIPLE trades at the same time at a given correlation run simultaneously. While I have constructed the spreadsheet/calculator that adjusts return for fees and multiple positions and given correlation based upon the “optimal bet percentage”, I have not yet figured out how I want to do this for the “simulator” yet.

Calculating multiple position sizes and determining the probability that both close down or up and by how much using only data such as correlation seems like a task that I am not quite sure how to do. Hopefully by talking my way through it I will come up with something as I develop this spreadsheet.

The next post I hope to accomplish a lot more and show you the developments of the spreadsheet. That’s all for today, class dismissed.

Comments »

WoodShedder Time! Creating A Quantifiable Approach To Position Sizing

Mullet

Part 1 WoodShedder Time! Creating A Quantifiable Approach To Position Sizing

Part 2 Building A “Position System Simulator”

Part 3 Building Cover Sheet, Determining Probability of Results (Position Size Simulator Part 2)

Part 4 Adding To The Cover Sheet

Part 5: Setting Up The Calculations

Since Woodshedder is semi-retiring from IBC, I decided it was a good time to kick off a more quantified approach in his honour(sic). While he quantifies the entire trading systems, I will be just setting up a spreadsheet that allows you to input either back tested quantifiable data, or looking at your history of results running a more discretionary system. The spreadsheet will then help you to determine position sizing.

There will be 2 spreadsheets, one is very close to complete, but requires some review to ensure I have not messed up a formula somewhere. This spreadsheet helps to determine “expectations” given a set of possible outcomes over a set amount of trades.

spreadsheet

I will explain all of this stuff someday and how I use it another time. Upon development of this spreadsheet, I have come to the conclusion that such leverage even at a fraction of this, is insanely reckless, and can produce hugely volatile swings in your bankroll that are entirely unnecessary. There is a very good chance that even over 50 trades that the system could mean losing a very large percentage of your bankroll. Since people don’t live forever they won’t be able to withstand “infinite” bets in a given system. I accounted for fees, the value of correlation and multiple bets, but it still isn’t enough for my taste.

Unfortunately, the first spreadsheet with all it’s formulas of modified kelly criterion / optimal F%, doesn’t give me enough data. Especially since I recently have learned what drastic draw-down such a strategy can produce and how if you happen to get that drastic draw-down it can take significantly longer to ever recover (perhaps longer than your lifetime), it can provide severe psychological risks (going on “tilt” as they call it in poker), and such volatility actually often makes fees do more harm betting more, than if you had just kept your bet small to begin with and not had such volatile swings in which the fees then become a more significant issue.

And so, I want to know the probability of ending up down after a certain number of trades, up 100%, down 20%, 50%, up 50% and things like this.

The goal is to construct a system simulator that takes a given system. The system will be defined with:

W1=ROI for result 1
W2=ROI for result 2
W3=ROI for result 3
W4=ROI for result 4
W5=ROI for result 5
P1=Probability of result 1
P2=Probability of result 2
P3=Probability of result 3
P4=Probability of result 4
P5=Probability of result 5

I have gone beyond this for my “optimal bet size” calculator. You can see 10 “results” but it can list up to 15 events (I hid a few rows in excel that aren’t visible in the jpeg). I could get more precise based upon a strategy such as a trailing stop that had several possible exits. I do not want to go beyond 5 results for the simulator.

So after 5 possible trades are listed, the “simulator” will be able to determine the set of data I want to know given the bet size listed, which can be modified until it gives me the set of data I am comfortable with, and give me a much better idea of what a given bet size will accomplish.

The next post is coming in a few minutes that will get into more details about building the simulator that I speak of that I will be building in front of you, screenshots and all.


Comments »