Most people look at breadth as advancers vs decliners. You can either look at the ratio of advancers to decliners, or the percentage of advancers vs all stocks (or percentage of decliners vs all stocks) expressed as a percentage bullish or bearish.
I like to narrow that list down by only considering “significant” moves. Why?
Day to day stocks move up and down chaotically for many reasons. Much less often, people are willing to chase a stock after it is moving upwards and continue to bid it higher beyond 1%, or continue to sell a stock after it has declined 1%. Even more rare than that, will you see them chase a stock up 2% or 3% or 4% or more.
Why Look at stocks that have made substantial moves when looking at breadth? By looking at significant movers I am eliminating the noise of day to day emotions to some extent. I am both looking at the percentage of extreme optomism (chasing stocks up) vs extreme pessamism (continuing to sell stocks much lower) as well as looking at positive economic, liquidity, and business cues (substantial earnings surprises for example will drive stocks much higher or lower than a 4% move). Either one when interpreted in proper context is a higher quality sample size then simple “advancers vs decliners”. Also a bullish swing trader’s dream is for stocks down big not to continue to go down and instead reverse and stocks up to continue their upside momentum. By looking at the data, you can determine as the moves get larger if the signals are more bullish as a sign of leadership and ideal swing trader’s conditions. You might also look at it from the perspective of Leaders vs typical market movement and compare a divergence.
Stockbee’s blog has a good article on using market breadth, and you’ll notice that his attention to 4% movers was something I adopted to one of the pieces of my litmus test of the market. But rather than track it at the end of day every day, I like to examine how it changes intraday and the “divergences” between the smaller movers and bigger movers, (and also consider it in terms of the context of “sentiment”).
Take today (06/05/14) for example.
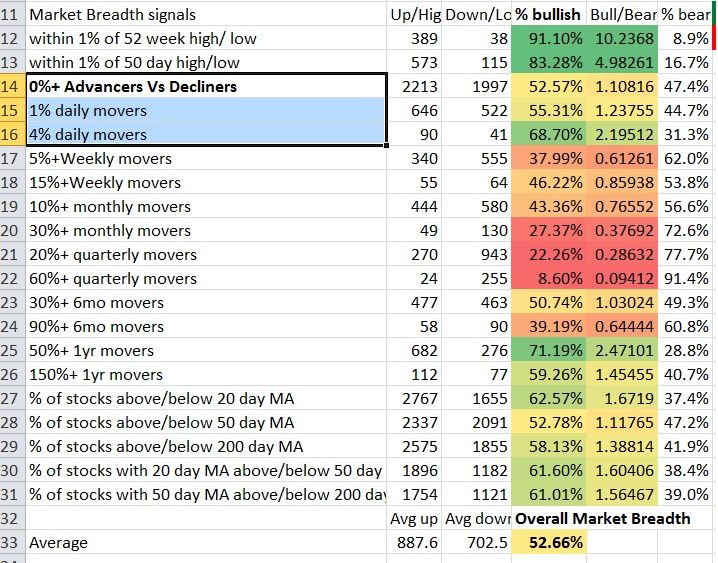
Above is the image of the excel breadth info that I use and update with a click of a button when I want in which I showed you the typical advancers vs decliners, the 1% or more movers, and the 4% or more movers. An hour prior to the update shown above, I actually saw all (0%+) advancers vs decliners less than 50% bullish while the 1% and 4% movers were more bullish. Look past the noise of just the chaotic range and almost random like behavior of stocks hovering near +1% and -1% and you would see that stocks up more than 1% vs more than down 1% are actually showing more bullishness than all 0% movers. Look beyond that to the names that are being chased for more substantial gains due to things like earnings, leading stocks, significant capital inflows signalling the start of significant accumulation, and explosive returning confidence, optomism and depending on the context of sentiment, could represent euphoria type moves at times, and you will see a DRASTIC shift from slightly bullish to substantially bullish. If you first see 4% over 50% while 1% and 0% movers are not and build on a previous signal to signal that the 0% and 1% have begun to become more bullish, that may signal that the leadership of the big movers is lifting the market.
You’d like to ideally see this kind of action to signal that some leadership is catching on, and that the market is reacting positively to the positive leadership, particularly since this is coming off of an environment where stocks long term have shown bearish leadership on say a 3 month time period until oversold levels were reached. The concern is that some of the strongest short term rallies come in a bear market and if you look past the rotation into the large and megacap stocks that has brought the “market” higher, you actually have bearish leadership that has occurred via significant movers. Now overall stocks are still more likely to be above shorter and longer term moving averages, and near highs than lows, but the market does have the appearance of mostly just upwards grind while a failure to catch a lot of trends to the upside and more likely to catch a trend to the downside. That has not been a very favorable conditions for investors and allocators, so hats off to anyone that has done well or hung on with those strategies, and even those remaining bullish over the last several months had fewer bright spots than usual, and a signal to consider getting to work swing trading.
Fortunately with the VIX lower it signals many of the option players, hedgers and speculators have been flushed out and that attempting to speculate with options is now more affordable. With the lower volatility may come the consolidation needed for the eventual break of the range and trend higher, and confidence in holding and adding to stocks that have trended up to return… Breadth certainly is not the only tool in the tool box, but there are so many ways to use breadth and a lot of information that can be gained by different methodologies of looking at it that it is an important tool. You can use it like most do to neutralize the market weighted indices to see if the bulk of the market is declining or advancing and by effect deduce whether the larger cap stocks are moving more significantly than the smaller cap stocks. Or if you monitor the significant movers, you can use it to identify whether stocks making leading moves are to the upside or downside and what those with a lot of capital are doing. You can then interpret whether the leaders are likely to lift or hold down the market, as a result of divergences and you can see what the underlying sentiment is doing to confirm your look at stocks and what part of the cycle the market is in, and you can use it to come up with a gameplan for the day or analyze results relative to the underlying conditions of the market.
I’m still getting used to learning the language of interpreting the various aspects that breadth can provide, but an active and dynamic breadth monitor as said can be a very important tool in the arsenal.
If you enjoy the content at iBankCoin, please follow us on Twitter