I have not always found the time to track breadth or I’ve either forgotten to save afterwards, or forgotten to track it, but I’ve been trying to make a more conscious effort to put up the breadth readings. An interesting observation is that the total average breadth is the worst it has been since I started tracking (at least worst I remember and if it was ever worse I didn’t record it).
![]()
I do know that in some of the better days in which I wasn’t tracking it that the % of stocks up 4% was over 10%, but unfortunately I don’t have record of it saved. The sudden shift from earlier on being under 3% to over 9% signals a decisive move in direction by a number of stocks in both directions.
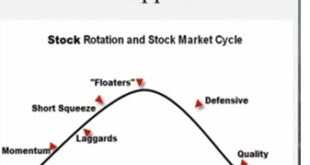
The unfortunate thing (and in some ways the fortunate thing) about breadth is there are different ways to interpret it. It has to be put into context. Breadth is only a measurement of advancers vs decliners. The major index or indicies are weighted heavily by the largest cap names and can’t tell you when a lot of stocks are up a little, when a few stocks are up a lot, or when a lot of stocks are down but a few megacap stocks are up. Breadth can help you look behind the curtain a little and interpret what’s going on under the surface. Alternatively, it can be used as a sentiment indicator and you can correlate it to interpretations of sentiment cycle to confirm risk aversion. You can look for leadership the way I set it up, and even analyze if it is “market of stocks”.
Although the numbers are objective, you can either see more oversold and value in buying the blood, or you can wait until things improve dramatically and follow after a “breadth thrust” (sentiment shift). This flexibility can be frustrating for some, but also very adaptive to your way of trading. An allocation strategy might wait to begin to shift allocation until there has been a decline and slowly begin to rotate in and then do so more aggressively after the oversold levels follow with a sustainable shift in breadth that is more than a couple days long. It tracks multiple time frames and you can look for whether or not there is substantial leadership making extreme moves one way or another, and the percentage of extreme moves that are bullish vs bearish.
The fact breadth is so bad in the context of believing this uptrend is not yet over, yet still vulnerable to an intermediate correction while still showing “aversion” in some growth names provides a lot more actionable ways to play my bias on different time horizons as breadth develops. I am in a bit of conflict here, but I believe the sell off in the russel is a precursor to the selloff in the S&P but that there will be some mean reversion. I would eventually expect growth stocks to lead on the next go around but it may be longer than usual until it sets up as first we may have to have some rotation. Additionally one of the CAUSES for aversion may be a reduction of risk ahead of earnings season. After that plays out whether positive or negative the market will have to react, and then eventually rotate their capital SOMEWHERE. I doubt see with yields so low that bonds are attractive, commodities aren’t exactly that attractive either, and so currency and stocks are the only places the vast pools of money will go. Eventually the pension funds will either start to become insolvent and go belly up or aggressively have to rotate into risk more aggressively, and possibly both. Their models of making 8% in the late 70s and early 80s when interest rates were 10-15% may have been fine in the past when the bond yield was super high in the 80s but there isn’t enough yield for that to remain viable at 2.5% 10 yr treasury. Eventually until we have public participation and euphoria, we will continue to find higher prices, although it may take substantially more time before the market sets up for the next rotation and it may correct in the mean time before it will chase into stocks so that may not help you as a trader over the next month or so.
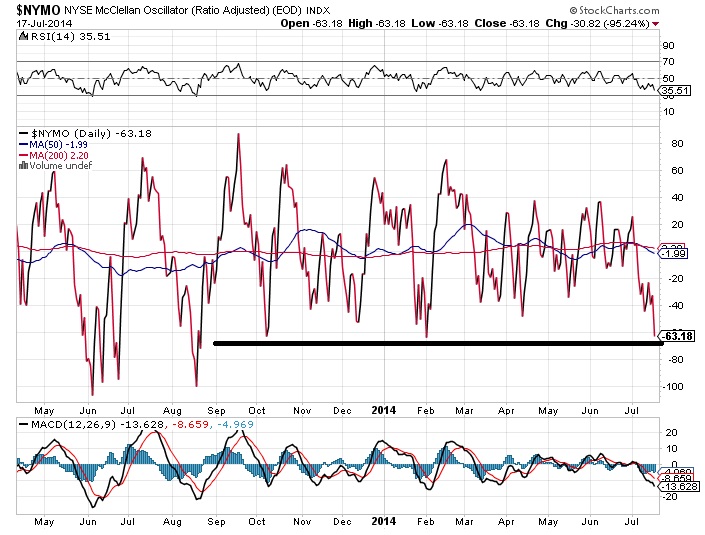
Another breadth reading (McCllelan Oscillator) is also as low as it has been in a long time.
If you enjoy the content at iBankCoin, please follow us on Twitter