The market as of late has been showing some signs of weakness which has frustrated many who expected nothing but higher prices. I think this is a great time to look back and see how far we’ve come and break down how this even happend in the first place. If you’re a new investor, lot of these lessons are great because you’ve bared witness to few things in the last year.
1) Nice smooth Rally from November to April.
2) A steep correction from April to June
3) A rally that defied all odds from June to present
I’ve only been actively investing for little over a year now so this year has been great to see every facet of the market. One that is trending up, down, and sideways. What I really want to focus on is #3: The rally that defied all odds from June. Since I trade purely off technicals I want to share a few charts that could help you if we come into a similar situation in the future.
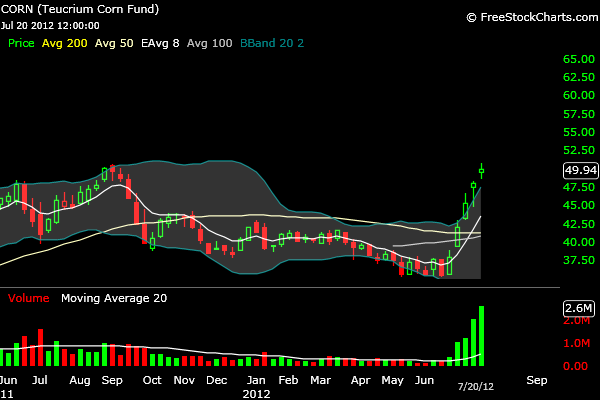
June 4th:
Entering the trading day on June 4th, the previous sessions we had seen heavy selling with lot of volume behind it. It was perfectly reasonable to expect that we were going to keep going lower to possibly tag 1200 (that was my target). What happend was we probed lower, but reversed and created a Doji. Now that candle doesn’t mean anything without follow through the next day, but that’s exactly what we got! If you look at the chart below, you can see clearly what happend:

Now of course you’re saying, “Hey Greg, it’s easy todo this in hindsight”. Yes, of course it is. What I’m trying to say is, if you bought on June 7th after the 6th was a positive close showing you the market had FOLLOW THROUGH to that reversal Doji candle, look at the position you would be in now. You could’ve simply set your stop few points under break even considering how far we pulled in the risk/reward was great. The chart was also showing us at the time MACD and RSI were improving. I remember many technicians as the days went on pointing out how it looks like we’re forming an inverted head and shoulders pattern which is very bullish. Around June 18th it was clear that right shoulder was forming and also where the neckline stood.
Another chart that could’ve helped you out during this time to show how lopsided the market had become was a Put to Call ratio chart. It simply measures how many Put options vs Call options there are at a given time in the market. Below it shows how on June 4th there were 1.35 Puts for every call out there being sold. Looking at previous years on the chart that area has often led to great buying opportunities over the years. I’m not saying every time we enter this area it’s 100% you will never lose money, but history has shown that this often will give you an extra edge which is all you need to make money over the long run.

Now most traders (myself included) chose to ignore a lot of this thinking that the market had to repeat what it had done in previous summers which was sell off hard. Technically, the charts were showing that at the bare minimum there was a bounce trade worth trying for on June 7th. It is also worth pointing out that this rally was not easy to stick with. Somehow, some headline from Europe or rumor over here would send the market rocketing higher. @ChessnWine will often repeat in his videos that these are just excuses for what market was going todo anyway. We can clearly see the buyers never let this market slip out of their hands showing up every time it looked like we were on the brink of collapse.

July 26th
One of the more important things that happend during this rally was finally around this time (give or take some sessions) we started to see the 50day moving average turn up. We had been following it for some time after the steep drop from April as traders we knew it could take some time smoothing it out. The sharp up and down action that happend during June and July did exactly that: smooth it out. I like to think of it as the market trying to get a grip on itself and move in a new direction so of course there is going to be wild indecision where price is swinging 1-3% (sometimes more). Once we started to enter August, the market took on a whole new form where everything became nice and calm. Notice the nice and tight candles? It seems very familiar to the rally we had back in November right? Completely different look from the wild swings back in June.
Final Thoughts:
Going forward, how can you be on the look out for something like this? Well, for myself now I have few things I do daily as a trader.
1) Check to see how lopsided the market has become in terms of people placing bearish/bullish bets. You can do this yourself on stockcharts.com http://stockcharts.com/h-sc/ui?s=$CPC&p=D&yr=3&mn=0&dy=0&id=p31058407684
Try to clean it up by removing RSI/MACD as it is not needed.
2) Be on the lookout for reversal candles after sharp pullbacks. The reversal candle itself doesn’t mean much, but if it has follow through the next day(s) the risk/reward is in your favor for taking on a position.
3) Watching the 50day moving average to see if the market is changing direction. We can clearly see in late July/early August the 50day starting to turn up and from there we rallied another 100 points.
4) Look for money to rotate. When the rally started we saw health care/defensive names start moving. Then it was the big caps, financials, and small caps that started to rocket higher.
Send me comments or suggestions @gregnb