iBankCoin
Joined Dec 4, 2012
319 Blog Posts

Why I Review YTD Returns Weekly

At some point in the year, you will come across a stock and say to yourself, “How the f#$% did this thing move up 100%? How come I was not aware?” Probably because you do not know how to screen for such names or are too lazy. Sorry but this requires some heavy lifting or work.

Each Saturday, I review the list of stocks up year to date. At the rate we are going, it is going from a 1-2 hour exercise to a 30 minute jaunt.

What I noticed this week is that most of the names I found up year to date were either restaurant stocks or retailers. Very few tech or healthcare names and no financial names. The lack of diversity is telling. So what tickers were of interest to me?

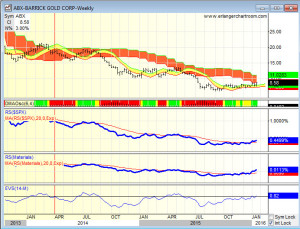
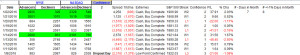
They are as follows: NDLS, M, ZUMZ, WING, FRGI, SAVE, ABX, TWX, KONA, SSW, CPB, DLTH and VCO. Why these names? Because I know the current story on all of them and just need to drill down more.

This gives me plenty to opin on over the rest of the week. From these names I will figure out names that have heavy short interest where the shorts are “dumb short sellers”. Then I will analyze earnings and revenues to see which of these names actually has an ability to grow. Last, I will analyze who owns these stocks and is recommending them to investor.

Basically C-A-N S-L-I-M for those who follow IBD or William O’Neil.

P.S. I am not of the camp the world is ending after today. Rather we are going to be extremely volatile for much longer than most think possible. More on this as we see this week play out.

Comments »

First Stock Pick Of 2016 And Continuation of Taser (TASR) Reco From 2012

Back in late 2012 and into 2013 we blogged here and in our stock picks went 8 for 9 and left one position open, Taser (TASR). The one loss dropped a whopping -2%, Sturm Rugr (RGR). If you travel back in our blog history, you will see that all we do is “throw touchdowns”.

We went long Taser at $7.67 on 12/17/2012 and it is now at $15.43 for a gain of $7.76 or 101%. We note the stock ran to a peak of  $35.95 and while we think it could get there again we are pretty confident it will trade north of $20 this year. We still like this name.

On to new picks, we like Barrick Gold (ABX). I run a daily screen that looks at stocks on a monthly and weekly basis. The goal is to find where the monthly price action is still a struggle but the weekly is set up to rip. I also make sure there is legitimate buying in the name and that from a relative standpoint the stock is beating the S&P 500 and its sector.

abx

Barrick Gold hits all these criteria AND it is just below its 200 day moving average. Once it plows above this level, buyers will push it higher just because it moved above its 200 day moving average. We know this is stupid but that is how the game is played.

Barrick Gold is a good play as gold begins its assault to new highs in the coming years. After deflation takes hold then hyper inflation takes off. Just look at Venezuela where interest rates are now 21% and inflation is at 720%.

As deflation fails then you move into hyper inflation. More on this in the next week. For now holding some gold makes a ton of sense. So much for $800 gold.

P.S. I am doing some work because the Packers and the Giants are no longer relevant and I am indifferent to those that remain. It is only background noise this afternoon.

Comments »

Advance/Decline Line Was Jiggy On Friday

The advance/decline for Friday came in at 4,258. At the September low reversal day that number was 2,855. At the August low reversal day that number came in at 4,061. So Friday was real.

adline

The last date that bear 4,258 was January 2,2013 when the number came in at 4,413. So the best number in over 3 years.

In fact, going back to the beginning of July of 2007 when I began tracking the advance/decline line Friday’s number was the 13th best number. We needed to see that big a number to confirm a potential bottom not necesarily the bottom is in.

We should rally for a couple weeks if Friday was not a dream and then we need to see what happens from there. More on this as the weekend progresses.

I am off the Wisconsin Dells which is where the “Water Park” began. Rates are $399 and up, so much for the concept of a recession. The whole place is booked. Clearly, all the Illinois bastards are not as broke as you might think.

Comments »

Year To Date Stats For 2016

I just ran year to date statistics through last Friday, January 15th. The results are scary. 828 stocks are higher which equates into 14% up for the year. 5851 stocks are lower which means 86% are down for the year. 

Last year 35% of all stocks were up for the year and 65% of all stocks were lower. So we are in a worse place than last year.

I did a further deep dive on the Pharmaceutical sector and the results are nasty. 32 stocks are higher and 486 are lower. That means 6% are higher and 94% are lower.  The Healthcare sector saw 24 stocks higher and 230 stocks lower. That means 9% are higher and 91% are lower.

So are we at the point where it is darkest before the dawn? Or are we going nuclear? We will answer this tomorrow.

Comments »

The Only Thing I Hate About Today

Today could FINALLY be the day for a meaningful bottom that may not be THE bottom but a bottom. The Russell 2000 is higher for the day and has cleared pivot at $99.24. The Russell is up 1.21% for the day now.

SPY is working to get above and stay above support at 186.14.  It is down only -0.56%. It has a chance to close positive on the day. So what do I hate about today.

We WASTED an opportunity for SPY to move below its October 2014 low at $180.92. Today’s low is $181.02. We missed it by $0.10. At some point, we are going to have to test this number. It might be tomorrow, next week, next month or next quarter but before we are out of the woods we need to touch this number. The computers know we did not touch that number.

Comments »

The Difference Between SPY and the S&P 500

Back in August we had a “Mini Flash Crash” especially on SPY. We are now lower on the S&P 500 index than in August BUT not yet on SPY. We need to test that low at $182.40. The sooner we do that the quicker we can find a bottom.

That low of $182.40 did happen and now we need to test it.

spy012016


Comments »

Things Could be Worse Today

The classic trade is a gap open or a gap down. Last Friday we had a gap down and that was the low for the day. In fact, the Russell 2000 was able to climb above support by the close. The S&P 500 and Dow Jones Industrial Average did not.

Today we had a gap open took us down to SPY’s Friday last two hour high, to the penny at $188.39, not once or twice but now three times. First at 9:50 and then 11:20 and now 12:10 before recovering in both cases before this latest drop.

ibc intraday

This is an odd pattern and one candidly I cannot recall seeing very often in the last eight months, since July. Usually a gap open that fails early on never recovers. Or a gap open, sticks and stays above the 5 minute range and then the one hour range to close near the highs. Today SPY is really trying to hold the gains. We need to watch closely. My gut says it is a coin toss where we go this afternoon, to new highs or another puke,

Recent comments from me have been very technical in nature BECAUSE we are at such a point in time. Normally, I do not need to go this granular. Hopefully this gives you some color that you are not getting from other inputs.

Comments »

Stupid Cheap

So I began this long journey of researching the stock market in 1986 when I graduated from college. Since then I have lived through the these difficult years 1987,1989,1990,1994,1997,1998,2000-2002,2007-2009, 2011 and now the latter half of 2015 into this year. Given that I am 51, I expect to have to live through another 10-15 such events in the next 30 years. There is perspective.

“I know it when I see it”. – Supreme Court Justice Potter 1964 on obscenity

The one thing I have learned is that we reach a point where stocks get “stupid cheap”. We definitely got there in 2009 when the S&P 500 bottomed at 666.  Since 2009, the end of 2011 qualifies as the last “stupid cheap” period. Currently, the entire market is not “stupid cheap” but sectors within the entire market are stupid cheap. Which ones?

No doubt about it energy and materials are “stupid cheap”. At the top of this story I have posted a recent oil chart so you can see the destruction. A good patch of retail is also”stupid cheap”. What leads me to know we are stupid cheap? When I can buy Bank of America (BAC) for $3 a share or Sirius (SIRI) for $0.80 that is stupid cheap.

The one thing you will learn about reading me is I start with statistics and not with hyperbole. Here are the statistic on year to date returns for 2015. The are pulled from the universe of stocks we follow in Erlanger Chart Room. The other statistics are from the Quantitative Partners database on market statistics.

2015 YTD

Higher 2319 34.27%

Flat           32    0.48%

Lower  4416  65.25%

Now let’s compare 2015 against 2014 and 2013.

Number of Down Days in 2015-2013

2015 132 days

2014 108 days

2013 106 days

Number of Days S&P 500 Fell  >-1% On A Closing Basis

2015 31 days

2014 19 days

2013 16 days

Number of Days S&P 500 Fell  >-2% On A Closing Basis

2015 6  days

2014 5 days

2013 1 days

2012 5 days

The takeaway from these numbers is that 2015 was a very tough year as The Fly has pointed out time and again. 2016 has gotten off to a horrific start as well but will it end that way? Following these statistics will allow us to see subtle changes as they take shape. I remain with a positive outlook on 2016 and feel that the current selloff is going to present itself with major multi year buying opportunities down the road. When?

I do not know. The only thing I know is to follow the bouncing ball and then when the data supports that we are getting there, to cast my line out into the water and prepare for a feeding frenzy.

Buy Low. Sell High.

Over the next couple days I will delve into more statistics on the “sh$% storm” we are living through but for now I am off to enjoy a day off and reflect on the importance of Martin Luther King on all our lives.

Comments »

IWM Line In The Sand Revisited

In doing some work at night on Monday night, I noted that the retracement on IWM from the October 2014 low to the recent high spoke very loudly to me.

Why?

The 100% retracement on IWM for this time is $103.54 and Monday IWM closed at $103.40. Well, we puked that level with today’s action.

However, it is notable that Tuesday IWM closed at $103.71. Wednesday’s intraday high was $104.42.

Today we are well back below that level at $100 at 3:03 p.m. EST.

So $103.54 is not far away. That said there is another retracement I am now following which is the November 2012 low to the June 2015 high. The retracement levels on that time are 38.2% at $108.13, 50% at $101.57 and 61.80% at $95.01.  Let’s see if we can clear the $101.57 level first then get back above $103.54. These are tough times but my gut says we are closer to a near term low than going over the cliff.

iwm new line in the snad

Comments »

The Machines Still In Control

Low and behold as quickly as SPY, DIA and QQQ got to their resistance levels they failed. On the dime. All in all a good day but the big boys like Fidelity and T.Rowe Price are no longer in charge.

So if you were disappointed by the close it is because you did not know that resistance on SPY for today was 193. I am going to bang into your head if you are going to trade either as a long term investor, Warren Buffet, or a short term trader, Stevie Cohen, then you better understand how to buy and sell in relationship to the machines.

Support on SPY today was 186.52 which is a really wide range. This was due to yesterday’s action. A wide ranging prior day sets up for a wide range the next day. Expect a wide range for tomorrow. Currently, ES H6 is off by 4 points which is nothing and tomorrow brings a ton of economic data with retail sales, PPI, industrial production and Michigan Sentiment. Premarket could be a mover.

If there is no follow through tomorrow, then the bulls will be fooled again. Will they?

Comments »