iBankCoin
Joined Dec 4, 2012
319 Blog Posts

The Week That Was

This is a new column that will appear each weekend. It is called “The Week That Was”. For the past several years, I have been writing “The Week Ahead” (TWA) so this is a natural addition to TWA. The goal of this column is to give a different twist on what just happened.

The past week was a shortened trading week as markets were closed around the world for Good Friday. In the U.S., the bond market closed on Thursday at 2:00 p.m. This helped the U.S. stock indexes climb higher in the last two hours.

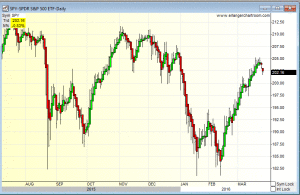
However, for the week stock indexes were lower across the board for the first time in six weeks. For the S&P 500, it fell -0.67%. The Russell 2000 fell -1.73%. Each week I track the spread between stocks with a strong technical rank and those with a poor technical rank was rather wide.  Stocks with strong relative strength lost on average -2.22% and those with a weak relative strength lost -1.63%. The conclusion is that investors and traders were locking in gains, playing defense.

Intraday action was weak for the first time in six weeks. Our confidence score on the intraday action was 33%. The range is typically between .10 and .90. Also, the advance decline 10 day moving average for the week dropped from 652 to 403. While positive, this is notable deterioration since March 4th when the peak for this current cycle was hit at 1,490.

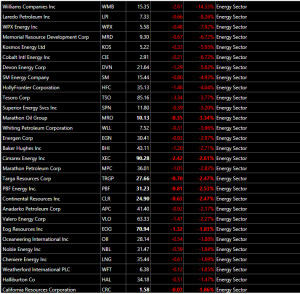
The only sector to put in a strong week was healthcare as it rose 1.4%. The worst sector was basic materials that included energy and materials. It fell by -3.5%. For the month there are no sectors in the red.

As such, the big worry for this week is whether profit taking continues with four days left in the quarter. When stocks move lower, typically treasury bonds moved higher and that happened in the week that was. Corporate bonds had a solid week rising 0.27%. High yield bonds fell by -1.17%.

A week ago Wednesday the U.S. Dollar (UUP) fell the day the Federal Reserve Open Market Committee (FOMC) announced its latest interest rate intentions. UUP then bottomed on Thursday and has been rising since. If the dollar strengthens, then that will become an  issue for stocks. Watch this move closely.

Emerging markets (EEM) fell by -1.97% last week. Meanwhile Europe (EFA) fell by -2.00%. China (FXI) also had a poor week dropping -2.79%.  On Thursday night, China will release its latest Manufacturing PMI data.

Conclusion: Last week was worse than what the headlines would lead you to believe. Caution is advised as we head into the last week of the quarter. 

Comments »

My “Go To” Chart Since Last Summer

Since last July, when uptrends end, I have found a great technical indicator that alerts me to get defensive.

That indicator is the Heikin Ashi Candle Sticks. When you look at a chart there are a couple ways to evaluate the action. First is a simple bar chart. Next is a candle stick. Third is the Heikin Ashi. Candle stick charts were developed by Japanes Rice Traders in the 18th Century.

The beauty of the Heikin Ashi over a normal candle stick is that the bar is color coded either green or red. Also, there is some pattern recognition built into the color coding. Therefore, you are getting more information than looking at a bar or candle stick chart.

Yesterday, Heikin Ashi Candle Sticks put up a nice red candle. Since the February 11th low, there have been a couple days that turned red but then resumed green. So currently, we now have the second day down. Once we get three or four in a row that are of size then the die is cast. You have been warned.

heikin


Comments »

The Long Short Tsunami

Hedge Funds that run a long/short strategy have been in a living hell since the S&P 500 bottom on February 11th. Why?

A very simple fact. Most got caught with their pants down. How do I know this fact? I see it in weekly numbers we track through Erlanger Research.

The worst scenario for a long short fund is to have their longs go up in value but see the shorts go up even more. My label for this is the “long short tsunami”.

In tracking, “short squeeze” stocks they were down -17.71% through the February 12th close. Meanwhile stocks where the “shorts were correct” fell -19.80%. So if you were buying short squeeze names and shorting heavily shorted stocks that were going lower you were up 2.09% through February 12th.

The S&P 500 in that same time period was down -8.77%. Such a deal. You were a happy camper as you were beating the S&P 500 by 10.86%. Your investors thought you were a god. Now let’s flash forward to last Friday’s close on March 18th. That spread of 10.86% is gone.

Now your long short book is losing -8.82% for the year and trailing the S&P 500 by 9.10%. That is a tough pill to swallow. Instead of being a happy camper suddenly you are worried if you are going to be in business next quarter. You are no longer a god rather you are a piker struggling with the masses.

The definition of insanity is doing the same thing over and over when you know the outcome. Long short guys know that they are going to have weeks and months like they just saw yet they do nothing to remove themselves from getting squeezed.

Such “upside down” outcomes happen typically once a year. Given the current volatility, I expect to see more of this type of action. So the action we saw from mid February into this week, might repeat itself if we plunge another couple hundred of points on the S&P 500. A strong likelihood if the Federales one week talk dovish and the next week turn Hawkish.  It seems the Federales need to be put on Prozac so they can remain calm with a consistent voice. Trying to manage an economy through the stock market is no way to go through life Mrs. Blutarski.

In my next column, I will discuss how to come aware that the long squeeze tsunami is about to commence. Suffice it to say, a big piece of the strategy revolves around understanding measures of oversold as well as tracking a variety of sentiment measures.

Remember it is always darkest before the dawn and if you are a vampire sucking the blood of others you better get back inside before the first rays of sunlight creep across the horizon.

Comments »

The Week Ahead: Historic Week As Cuba Goes Legit

1.Geopolitical and Fiscal Events.

Monday sees Federal Reserve Richmond President Lacker speak at 2:45 p.m. EDT and Atlanta President Lockhart speaks at 12:30 p.m. EDT. Monday night Federal Reserve President Bullard speaks at 8:30 a.m. EDT. Over the weekend, President Obama headed to Cuba and remains there until Tuesday.

Tuesday sees Federal Reserve Chicago President Evans speaks at 12:30 p.m. EDT.

Federal Reserve Philadelphia President Harker speaks at 6:30 p.m. EDT on Wednesday.

Thursday sees Federal Reserve St. Louis President Bullard speak at 8:15 a.m. EST.

2.Economic Releases. Releases of note this week include the weekly chain store sales, oil/gas numbers, mortgage applications and existing home sales, new home sales, durable goods and Q4 GDP (final read).

3.Earnings Releases. Notable releases include IHS YY NKE RHT GIS PVH CAN GME.

Monday, March 21:

February Existing Home Sales is due out at 10:00 a.m. EDT and is expected to drop to 5.31 million from 5.47 million.

Markets are closed in Japan.

President Obama continues his Cuba trip.

Tuesday, March 22:

Caucuses are held in Utah and Idaho, while Arizona holds a primary.

Wednesday, March 23:

February New Home Sales is due out at 10:00 a.m. EDT and is expected to rise to 510,000 from 494,000.

President Obama continues his spring break tour with a visit to Argentina.

Thursday, March 24:

February Durable Goods is due out at 8:30 a.m. EDT and is expected to drop to -2.5% from 4.7%.

The U.S. bond market closes early at 2:00 p.m. EDT.

The latest short interest data from the NYSE and NASDAQ is due out after the close.

Friday, March 25:

Markets are closed in the U.S. and around the world for Good Friday.

Q4 GDP (final) is released at 8:30 a.m. EDT and is expected to remain at 1.0%.

Comments »

Do The Work Or Do Not Show Up Each Day

Each day I put together key inputs that will influence the trading. If you do not do this and you trade, then you are a fool playing a fool’s game. Countless players know these inputs and are ready to pounce. So the question you need to ask yourself is are you a lamb competing against a pack of wolves?

March 16, 2016

In After Hours Trading

IPOs on deck this week Spring Bank Pharmaceuticals. Secondaries on deck CONE NUAN NXPI SENH.

In After Hours Trading: ORCL +.02.

Lower Guidance: FOGO.

What’s Happening This Morning

U.S. futures: S&P -1.50, Dow Jones -9, NDX +0.25 and Russell 2000 -2 with fair value higher hurting gains. Asia and Europe mixed.

Copper, silver and gold higher. WTI Crude and Brent Oil Futures higher. Natural Gas is higher. $ is higher vs Euro, higher vs. Pound and lower vs. Yen. US 10 year Treasury yield at 1.96% yield +3, one month change +19 and -11 one year change. Prices as of 7:50 a.m. EDT.

Top Sectors None of note.

Weak Sectors Healthcare, Basic Materials and Financials.

One month winners Conglomerates, Basic Materials , Industrials, Services and Financials.

Three Month Winners Utilities.

Six Month Winners Utilities, Technology, Industrial Goods and Consumer Services.

One Year Winners Utilities.

Year To Date Utilities, Conglomerates.

Earnings Expected

Earnings due after the close (by avg. trade volume): FDX CTRP SLW WSM QUNR JBL GES HMIN MLHR JMEI.

Due Thursday morning (by avg. trade volume descending): LEN MIK IGT VNCE.

Rags & Mags: Inside Wall Street

Bloomberg: Fed Day and some economists expect a rate change. Trump and Clinton assert themselves in yesterday’s primaries. OPEC and non-OPEC set April 17th as meeting date in Doha on production caps.

Reported Earnings This Morning

Reported Earnings This Morning (Best to Worst absolute beats/misses [+.02 or greater/-.02 or worse]): RTK -.40.

Lower Guidance: none of note.

Current Morning missing: ATU ARCO CMCM.

Data Points

Yesterday saw 786 stocks rise and 2255 fall on the NYSE. NASDAQ saw 707 rise and 2113 fall.

The SP 500 is back above its 50 day exponential moving average but now above the 200 day exponential moving average. The Russell 2000 is back above its 50 day moving exponential average and still below its 200 day exponential moving average.

The 10 day spread moving average of breadth is back to invested. The Madison Market Timing Indicator is still invested.

YTD 3075 stocks are higher for 2016 and 3351 are lower. Updated 3/4/16 Close.

Economics

February CPI is due out at 8:30 a.m. EDT and is expected to fall to -0.2% from 0%.

Also at 8:30 a.m. EDT, February Housing Starts is expected to rise to 1.15 million from 1.10 million.

At 9:15 a.m. EDT, February Industrial Production should fall to -0.3% from 0.9%.

Politico

The FOMC announces its latest interest rate decision at 2:00 p.m. EDT. A press conference with Federal Reserve Chairman Yellen will occur at 2:30 p.m. EDT.

Bank of Japan minutes due overnight out at 6:00 p.m. EDT.

Conference & Analyst Meetings

Meetings or announcements of note EXPE CALX SCOR ARRS. Roth Conference. Citigroup Global Property CEO Conference. Barclays Global Healthcare Conference. Bank of America Merrill Lynch Consumer & Retail Tech Conference. Bank of America Global Industrial Conference.

Conference of Note

South By Southwest.

M & A News

Key Upgrades and Downgrades

Firm Upgrades Downgrades
JP Morgan GLOG
Goldman Sachs
Morgan Stanley GPS
Deutsche Bank
Citigroup
Merrill Lynch
Wachovia/Wells Fargo
Credit Suisse MJN LM
Banc of America
UBS
Stifel
Sterne Agee
Jefferies
Piper Jaffray
Needham
Raymond James
Credit Agricole
Friedman Billings
RBC
Maxim CMG

Comments »

Locking In Gains On $TASR

Back on January 24th, I discussed how in late 2012 and into 2013 I blogged here and the stock picks went 8 for 9 and left one position open, Taser $TASR.

The one loss dropped a whopping -2%, Sturm Rugr $RGR. If you travel back in our blog history, you will see that all I do is “throw touchdowns”. That is the beauty of writing a blog, you can see the history and whether I am the real deal or full of it.

I noted that I went long Taser at $7.67 on 12/17/2012 and it was at $15.43 for a gain of $7.76 or 101% on January 24th. The stock ran to a peak of  $35.95 and I thought it could get there again, We were pretty confident it could trade north of $20 this year. We still liked this name back in January.

In the first part of March, Taser has traded above $20 and now we are removing our recommendation from January 24th. The gain is $3.86 or 25.01%. In the same period, the S&P 500 is up by 5.88%. Since writing in January, this is the second winning recommendation and there have been no losers.


Comments »

The Week Ahead All Eyes On Grandmonster Yellen From Super Mario Last Week

The Dow Jones Industrial Average, the S&P 100, Russell 2000 and the NASDAQ 100 all rose for the fourth week in a row.

1.Geopolitical and Fiscal Events. Monday sees OPEC release its monthly update. Tuesday sees multiple primaries held. The Bank of Japan also is out with its latest release. Wednesday sees the FOMC announce its latest interest rate decision. Thursday sees the Bank of England announce its latest interest rate decision. Friday sees Federal Reserve St. Louis President Bullard and New York President Dudley speak. Over the weekend, President Obama heads to Cuba.

2.Economic Releases. Releases of note this week include the weekly chain store sales, oil/gas numbers, mortgage applications and PPI, retail sales, CPI, housing starts, industrial production, Philadelphia Fed Survey, leading indicators and Michigan Sentiment.

3.Earnings Releases. Notable releases include DDD MNKD ORCL FDS FDX CTRP ADBE LEN CTAS TIF.

Monday, March 14

OPEC publishes its monthly oil report.

Tuesday, March 15

Primaries and caucuses are held in Florida, Illinois, Missouri, North Carolina and Ohio.

The Bank of Japan is out with its latest interest rate decision and no change is expected.

The Federal Reserve Open Market Committee (FOMC) begins a two day meeting.

February PPI is due out at 8:30 a.m. EST and is expected to drop to -0.1% from 0.1%. At the same time February Retail Sales is expected to fall to -0.1% from 0.2%.

Wednesday, March 16

The FOMC announces its latest interest rate decision at 2:00 p.m. EST and then a press conference with Federal Reserve Chairman Yellen occurs at 2:30 p.m. EST.

February CPI is due out at 8:30 a.m. EST and is expected to fall to -0.2% from 0%.At the same time, February Housing Starts is expected to rise to 1.15 million from 1.10 million. Then at 9:15 a.m. EST, February Industrial Production should fall to -0.3% from 0.9%.

Thursday, March 17

The Bank of England (BOE) is out with its latest interest rate decision and no change is expected.

March Philadelphia Federal Reserve Survey is expected to improve to -1.2% from -2.8% when released at 8:30 a.m. EST. Then at 10:00 a.m. EST, February Leading Indicators is expected to improve to 0.2% from -0.2%.

The latest Bank of Japan (BOJ) minutes are due out at 6:00 p.m. EST.

Friday, March 18

President Obama heads to Cuba on Saturday for a diplomatic visit.

March Michigan Sentiment is released at 10:00 a.m. EST and is expected to rise to 92.1 from 91.7.

Comments »

Could The FOMC Raise Next Week?

Is there any chance with stocks back to basically flat on the S&P 500 that Grandmonster and her  Evil Cousin (Stanley Fischer) could decide to go ahead and raise another 25 basis points? Nobody seems to think that is a possibility. Nor do I think they would be that stupid but then again they have done some pretty stupid stuff.

Just a thought as we head into the weekend. Super Mario failed to send the Euro lower but a raise by the FOMC would take care of that.

It seems at the G-20 the central bankers all agreed to stop slashing rates but that does not preclude an increase.

One has to think how stocks would react to such a move and IMO it would be rather fugly.

Comments »

Epic Garbage Rally In Oil Patch, But Blood To Return Soon

Last week Energy names where the Shorts Are Correct Rose by 21.54%. Short Squeezes in the energy patch rose 10.48% last week. Those returns are a week not a year.

Notable winners among the names where the Shorts Are Correct last week included $WLL up 82%, $NE 60% and $RIG 47%.  This week is a different story.

$NE has fallen -16% since last Friday. $RIG -14%. Interesting that $WLL is higher by 13%. It is doing what it supposed to be doing. Many other energy names are not. Be careful if you are renting these P.O.S. names.

One of my long time buddies Ben Woodward puts together a list of stocks each day that he labels the Get The F#$% Out  (GTFO) List. Produced mid day it was littered with Energy names.

gtfo

The bottom line is Energy may have these short squeeze rallies over the next couple of years but the long term trends are not up for debate. Two charts below should scare the crap out of any oil man or oil investor.

oil death

oil death2

The point of the charts is VERY simple. 2015 was an outlier in terms of inventory.  Now 2016 is a huge outlier on 2016. Unless demand rises huge, and it cannot, then price has to come back down. This is Econ 101 Supply & Demand Curve Analysis.


Comments »

Bull Market Enters Its Eight Year, Not!!!

The S&P 500 bottomed at 666 on March 9,2009 this much is true. To claim that “the stock market” has been in a bull market since then is totally flawed thinking.

First of all, the S&P 500 is not the entire stock market. Last time I checked our database had 6,680 stocks as of last Friday. Therefore, the S&P 500 is less than 10% of that number. Granted it is a huge percentage of the market capitalization of the overall stock market.

Since March of 2009, there have been two bear markets and we are living through the second such one right now. The Russell 2000 which is a broader measure of the stock market lost -26.40% from 6/23/15 to 2/11/16. Then in 2011, it lost -25.04% from 4/29/11 to 10/4/11.

Millions of Americans own stock in their 401K on the other 6,180 stocks that are not in the S&P 500. So if the broader index fell into a bear market, then those that were invested in company stock via a 401K saw a big hit to their net worth not once but twice since 2009. No wonder Americans are pissed off at their inability to recover from 2007-2009.

The classic definition of a bear market is a drop of -20% over a minimum of two months on either the Dow Jones Industrial Average or S&P 500. Funny how the other indexes do not matter in determining if investors lived through a bear market. Clearly, an attempt to put lipstick on a pig.

During the above bear markets on the Russell 2000, the S&P 500 fell -13.96% in 2015/2015 and -18.61% on a daily closing basis  during 2011. If we looked at 2011 on an intraday high to intraday low, indeed the S&P 500 was in a bear market in 2011 as it fell -21.58% using intraday high and lows. Someone clearly is trying to keep the myth of buy and hold investing alive.

Tomorrow we will look at the rebound from 2/11 and determine if in fact this is for real or just a garbage rally.

Comments »