iBankCoin
Home / firehorsecaper (page 2)

firehorsecaper

Tokyo based, expat Cape Bretoner. Learning to live in a de-leveraging world. Better suited to the crusades. CFA & FRM charter holder. Disclaimer: @Firehorsecaper reminds investors to always perform their own due diligence on any investment, and to consult their own financial adviser or representative when warranted. Any material provided is intended as general information only, and should not be considered or relied upon as a formal investment recommendation.

MOMENTUM INVESTING: $MTUM; THE DAY THE MUSIC DIED

Note: MTUM: iShares MSCI USA Momentum Factor ETF (monthly returns, incl. dividends).

MTUM has $10.5bln in AUM (0.15% expense ratio). The average P/E is 31 and P/B 6.24. The top 10 momentum names owned by the ETF carry a 42% weighting in aggregate; AMZN, MSFT, VISA, BOEING, MASTERCARD, JP MORGAN, CISCO, NETFLIX, INTEL & ADOBE. The annualized vol of $MTUM is 15.6% vs. a compressed 12.5% for the S&P (87″ S&P index vol spiked to 50, 2008 > 62). S&P correlation is +0.95 as one would expect.

This graph is one all investors should heed this week. Black Monday is soon upon us, an ominous anniversary. Momentum investing has had a great run, as the graph reflects, but the blade has 2 edges, as investors are finding out. We kissed the 200 day m.a. like Joe Biden, with intent. This week, all eyes are on the heartless bots, ready to sell indiscriminately if/when the key technical level is breached decisively. $SPY ETF is the big dog, $280 billion in AUM (0.28 trillion). SPY monthly returns through October 18, 2018 are much less extreme at the margin, but note in the Feb. 2018 market hiccup MTUM outperformed SPY:

Note: SPY: SPDR S&P 500 Index ETF (monthly returns, incl. dividends).

If you are going to panic, panic 1st. There is a great deal of AUM managed via momentum metrics at present (sitting somewhere between traditional active and passive management). Backtests reflect outperformance based on side-stepping the big drawdowns in the equity market; the decision factors can be tweaked but a standard weighting is 40% on 3 mth returns, 30% on 20 day returns and 30% on 20 day volatility. Risk assets are sold in favor of ETFs like SHY (Barclay’s Low Duration Treasury, 2-yr) that will hold in should the market continue to plummet into the bowels of hell. It is all very methodical, “Jesus take the wheel” kind of stuff and risk assets are not entertained until the model says to (on a decided turn for the better in terms of observed performance). There will be little sign of rotation, EM (China, Russia, Brazil, India, Indonesia ….) don’t make me laugh. EEM, the biggest emerging markets ETF has AUM of $30bln.

Note: EEM: iShares MSCI Emerging Markets (monthly returns, incl. dividends).

This is a binary risk on/risk off allocation decision. Think light switch. The lights go off. Downside volume has been outstripping upside by as much as 40% in cruel October 2018 so far, but it could be just throttle steering so far.

We are all aware of the macro factors that got us to this precipice. Italy, China-USA relations, hard(er) Brexit, Fed rate hike cycle (US Dollar strength), QE unwind, Saudi fight club, and mid-term elections in the USA.

Buckle up. Keep your wits about you. JCG

Follow me on Twitter @firehorsecaper

Comments »

CHINESE AUTO STOCK: Geely Automobile Holdings Limited (0175.HK)

Late cycle, autos struggle, leading some to question when “cash for clunkers 2.0” might be given consideration for the US market. China overtook the USA as the largest car market in 2009 when 13.8mm units were produced. By 2014 23.7mm units were produced for a 26% share of global automobile production. As of 2017 China is at 30% with 29mm units.

Globally, auto stocks are having a terrible 2018:

Toyota: -6% Nissan: -9% Tesla: -16% Volkswagen: -16% Honda: -17% GM: -18% Daimler: -22% Ford: -25%

Geely Auto Holdings Ltd. rallied 5% today on the announcement of a ride hailing JV with Daimler for the China market, in a bid to take on Didi Chuxing. Didi is larger than Uber and is expected to achieve a mkt valuation of $70-80bln when it IPOs in Hong Kong. To put Didi’s private valuation into perspective, Daimler’s market cap is $67bln and Geely is a mole like $16bln. Geely is Daimler’s largest shareholder at just over 10% ($9bln invested in February 2018, now worth $6.7bln).

Under Li Shufu’s leadership, Geely has been both acquisitive and opportunistic in managing their stable of brands. One standout purchase was Volvo Cars, which Geely bought for $1.8bln from Ford in 2010. As Fiat did with Ferrari ($RACE), Geely plans to spin out Volvo Car by way of an IPO when the environment is more accepting. Joint underwriters Citi, Goldman and MS had a range of $16-30bln in mind for Volvo Cars, who have put up record sales for the last 4 years and respectable EBITA of $1.6bln per annum. Even with the low end valuation for Volvo Cars, it is not hard to back into a sum of the parts valuation that makes Geely a compelling investment in a challenged industry (the cleanest dirty shirt, if you will). Unlike Daimler, where cars and trucks are under the same corporate umbrella, Volvo separated the two some time ago. AB Volvo is the publicly listed truck division of Volvo. Geely separately invested $3.3bln in AB Volvo.

Geely Automobile Holding Limited:


$125bln HKD, USD/HKD 7.82 US$ market cap $16bln

US$ 16bln Enterprise Valueess: Daimler investment $6.7bln, AB Volvo investment $3.3bln, Volvo Car IPO valuation $9.6bln (60% of low end IPO valuation, to account for timing, execution risk).

Net value paid for Geely: US$-3.6bln.

This seems a comfortable buffer for further downside (i 22.5% of current value), especially when Geely itself is down 45% year to date 2018. The dividend yield is 2.05% as well.

In addition to the 4 sedan variants and 3 SUV/Crossover models marketed under the Geely nameplate, Geely is controlling shareholder in Proton Holding (long standing Malaysian value brand), Lynk & Co., London Electric Vehicle Company and Lotus. The new Proton SUV will be produced on the same line as the Volvo XC40 in China, with clear “rub off” quality effect expected to bolster sales. Perceptions of quality change over time, look at the reputation of South Korea’s Hyundai over the last decade. The new Genesis G80 looks as polished as anything coming off the line in North America.


I like the Geely story, even if the Volvo Cars IPO gets shelved or delayed. Volvo had made a commitment that all their cars post 2019 will be electric. Looking at the reception newcomers like $NIO have received by the auto EV market, an incumbent with onshore China manufacturing capability could be a powerful combination.

I’m long at HKD$14.00 (US$1.79) and I think a double is not out of the question within a 12-18 month time frame. The strongest near term price catalyst would be a Volvo Cars IPO at a $16bln + valuation in Q1 2019. I’m not too concerned with the fx risk of buying in HKD (peg to USD). There is very good volume for 175.HK but scant volume in the otc listing $GELYF. Note: Also long $NIO, but it is high beta compared to $175.HK.

Follow me on Twitter @firehorsecaper

Safe trading. Caleb Gibbons

Comments »

OZ GOLD RUSH; RNC MINERALS ($RNX.TO, $RNKLF) – LARGEST GOLD NUGGET EVER MINED

I have written on miners several times in the past for ibankcoin from the peanut gallery, but from inception no event has been as profound, so glorious, as the “Fathers Day Vein” find by Canada’s Royal Nickel Corp., dba RNC Minerals (RNX.TO, RNKLF otc/pink sheets) at their 100% owned (via sub lease) “Beta Hunt” mine in Western Australia, at Kambalda, 560km (320 miles) from Perth.

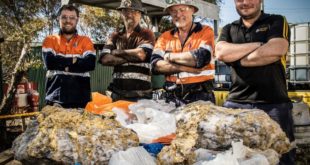
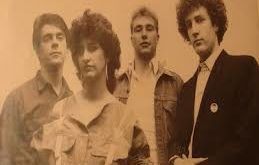
RNC Mineral have mined specimen rocks, from a single cut, with visible gold this month from their Beta Hunt mine grading in excess of 2200 g (68.4 oz.)/t (no typo). The largest specimen rock at 95kg. had 69kg. of total gold (quartz making up the bulk of the rest) and required no further processing, being sent directly to the Perth Mint. The scale of this discovery should not be discounted. The nugget sample is the 2nd largest ever mined by man and the grouping  of high grade nuggets ranks in the top 10 ever found (107 billion humans have lived on Earth since existence, 7 billion currently present and accounted for). Profile picture with the larger “Fathers Day Vein” specimen rocks features from left to right; SLM Geologist, Lachlan Kenna, Air-leg miner credited with the find Henry Dole, Beta Hunt mine foreman Warren Edwards and Snr. Geologist Zaf Thanos. Happy lads all.

Strike length continues to be refined (2x original now) and an addition 2 km of potential lies ahead. The gold find, from a space basically the size of a large living room, is 24,000 ounces (worth US$29mm, C$38mm). This leads all to think house, football field, airport runway, Newark, NJ., hence the buzz. Given the richness of the find, margins have been estimated at 90%. The specimen stones will likely be sold at auction for a premium as high as 30% to the gold content (15% offered already by yet unnamed museums). The interweb is loaded with coverage on the story as one might expect. In the age of social media issues of continuous disclosure are sure to arise, but the team at RNC Minerals seem up to the task at hand.

Press release related to the “Fathers Day Vein” discovery by RNC Minerals at their Beta Hunt mine is available on their website; http://www.rncminerals.com/2018-09-20-Fathers-Day-Vein-Yields-24-000-Ounces-of-Gold-Worth-38-million There is an informative Webcast of their 11-Sept.-2018 press release which is worthwhile also. For further information: Rob Buchanan, Director, Investor Relations, T: (416) 363-0649, www.rncminerals.com


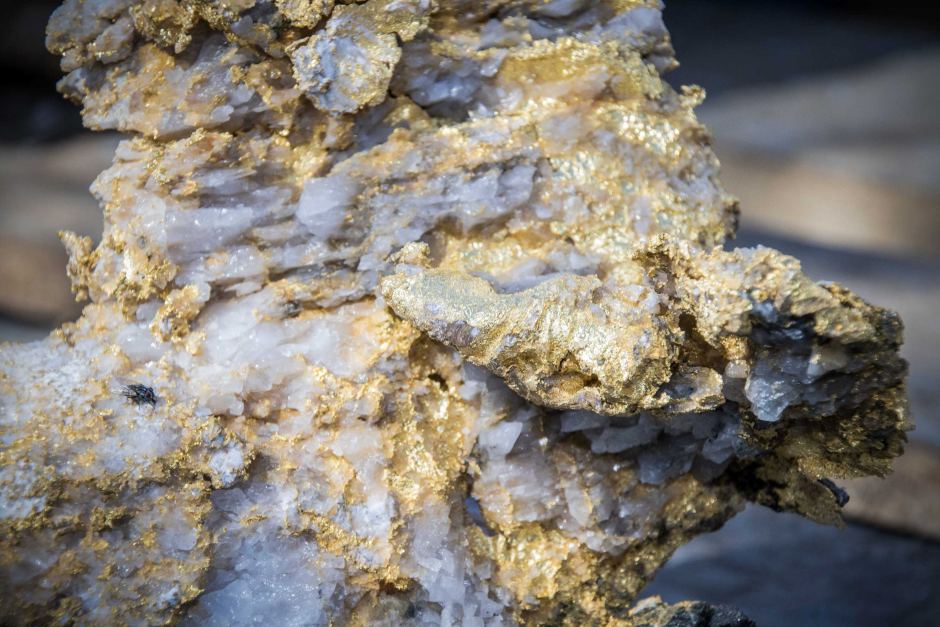
Note: The other visible metal in the sample is quartz (fly is for scale I assume).

Mining has become expensive, the easy stuff has been done …so we thought. Many jurisdictions are difficult to operate in, subject to government overreach and/or outright nationalization. Spectacular gold grades are largely a thing of the past, trending to 2-3 g/t (5g/t was thought to be economically viable at historic gold prices). . Pretium, $PVG, another Canadian miner, was putting up (modern day) staggering numbers of 14.1 g/t from their Brucejack mine in British Columbia, Canada. Recent Milli Vanilli allegations re: sampling abnormalities have compressed PVG’s market cap aspirations, but with a market cap of $1.6bln Pretium is still a full 10x bigger than lowly junior miner RNC Minerals.

https://ibankcoin.com/firehorsecaper/2016/10/19/pvg-pretium-resources-theres-gold-in-them-thar-hills/#sthash.NM4hjYZG.dpbs


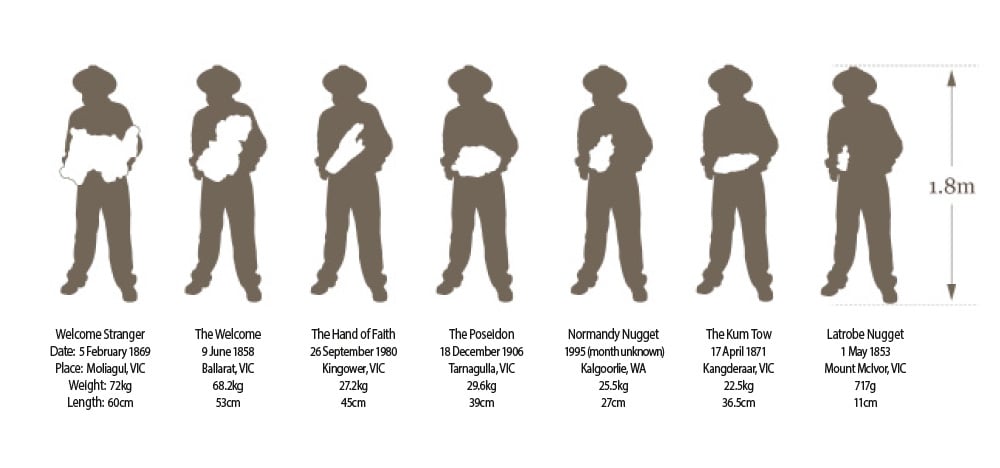
Many of the biggest finds (individual gold nuggets, of all time) have been Australia domiciled:

Top left in the graphic, Welcome Stranger (mined In The Year Of Our Lord 1869) from Australia netted 2520 troy ounces of gold. The biggest nugget of the “Father Day Vein” netted 2440 ounces for a very close 2nd place, but now takes the record as the largest nugget still in existence.

Largest nuggets still existing (others processed for precious coins and deliverable bullion by various mints):

1.) Canaan nugget, Brazil 1983, 60.8kg. (1682 troy ounces).

2.) The Great Triangle, Russia 1842, 36.2kg. gold assay 91% (32.94 kg gold). (Father’s Day Vein 82.5% 95 kg. gross, 78.4 kg gold).

3.) Hand of Faith, Australia 1980, 27.66kg. (largest ever found via metal detector …. a good day), currently housed at the Golden Nugget in Las Vegas, NV, USA.

4.) Normandy nugget, Australia 1990, 25.5kg. (820 oz. gold … 80-90% purity).

5.) The Kum Tow (aka Kum Fow, Rum Ton), Australia 1871, 22.5kg.

6.) Ironstone, “Crown Jewel”, 1992, California, USA 16.4kg.

RNC Valuation:

As with many mining juniors, RNC has has its ups and downs, on balance, more downs of late. As you might expect from their name, Royal Nickel Corp. (dba RNC Minerals) is primarily a nickel miner. Their key asset is their 28% stake (JV with Waterton) in the Dumont Nickel-Cobalt Project in Quebec, Canada. The project contains the world’s biggest reserve of both cobalt and nickel (demand coming largely from the growing electrical vehicle market). The value of Dumont alone was enough to justify the C$0.44 (US$117mm market cap) price once you take insolvency off the table, which is what the Beta Hunt gold find has done. Money was tight and RNC was in the midst of selling “non core” Beta Hunt to fund their portion of the development plan at Dumont (C$1bln total cost). Dumont has a mine life of 33 years and 1.18 billion tonne reserve (proven & probable), containing 3.15mm tonnes of nickel and 126k tonnes of cobalt. The Father Day Vein find of 24,000 oz. of gold at the working Beta Hunt mine in Oz has clearly taken sale off the table (potential suitor likely steamed at the timing). Assuming the current valuation is largely for Dumont (Ni-Co), the Beta Hunt gold call option is hard to value until further exploration work is done to define the potential scope. What we do know is 12mm ounces of gold have come out of the region of which Beta Hunt is a part of. RNC Minerals are the first to explore the Lunnon Basalt at this depth (500 meters), level #15 (of 6 levels total being mined). Gold Fields Limited have rights to the first 200m as I understand it, with RNC mining below that depth threshold.

Eric Sprott, a self-made Canadian billionaire likes the RNC Mineral story, a lot. This week in a regulatory filing Mr. Sprott announced he had purchased 561,000 shares of $RNX.TO on the open market at an average price of C$0.4284, taking his ownership % > 10%. The bulk of Eric’s holding are from a 2016 bough deal financing which came with warrants (9.265mm exercised this week at C$0.43). Current shareholding 40.2mm shares of common. The current float is 390.3mm shares (fully diluted 477mm). Eric does a weekly for Sprott Money and has never seen anything like the specimen stones mined at Beta Hunt.

The majors will be all over developments at Beta Hunt. There has not been a find of this magnitude in a long, long time. RNC Minerals owns 100% of Salt Lake Mining (SLM) who purchased Beta Hunt in 2013 for A$10mm, mining rights secured from Gold Fields Limited ($GFI).

RNX.TO shares went from lower left to upper right all day Friday (yesterday 21-Sept-2018) closing up 31.7% at C$0.56 on 27.99mm share volume. The US dollar RNKLF (oto, pink sheets) closed at $0.4389, up 30.9% on 2.29mm shares.

Conjecture on the potential share price is premature until further mining is undertaken by SLM at Beta Hunt. Any indication of repeat occurence or continuity of the current seam will be well received given the richness of the recent grades. The geography has shown itself to be condusive (gold in quartz touching sediment), but coarse gold finds (>10g/t) typically do not have the consistency of lower grade gold mines. SLM previously had a plan of mining 60,000 ounces of gold per annum from Beta Hunt. How much there Beta Hunt numbers go up will take time to discern, the good news is they will have the money to get on it with a much quicker timetable than their budget previously allowed (114 employees; mgmt, tech srv and operations). While a micro cap at present (<$300mm), this is not a low float stock with almost 400mm shares outstanding. Real movement will only come with real results, but anchor investor like Eric Sprott help to provide a floor pending further clarity. This is a story and a ticker to monitor. In Q4 2010 RNC Minerals stock traded at just over C$2.50, as a point of reference.

Mark Selby, President & CEO of RNC Minerals takes the floor at the Denver Gold Forum Monday next at 4:30pm and you can bet RNC and Beta Hunt will be the belle of the ball. I will be watching developments closely.

Safe trading.

Follow me on Twitter @firehorsecaper

Regards, Caleb Gibbons, CFA

USD/CAD 1.2912

Disclosure: Long RNX.TO from open 21-Sept-2018 at C$0.44. On position sizing, I have a rule of thumb that has served me well in terms of sleeping at night on idiosyncratic single name exposure; never invest more in a single stock that you would pay for a car. I bought 100,000 shares.


Comments »

DIGICEL: EM BONDS – TIME TO BUY?

Denis O’Brien, Ireland’s richest native ($4.3bln) is the 94% owner of Digicel Group. Digicel Group offers telecommunications (wireless, cable, and business services) media and entertainment services to 14 million subscribers in 32 markets, primarily in the Caribbean and Central America. Largest markets; Haiti (16% revenues), Jamaica (16%), Papua New Guinea (13%), Trinidad & Tobago (6%).

Digicel bonds have been the worst performing emerging market bonds of 2018, losing 30% of their value year-to-date.

Macroeconomic/FX Risks:

The strengthening US dollar had been a big factor and analysts expect the effect to be ongoing, lessening top line revenues by as much as $220mm and EBITDAR by approx. $100mm per annum. A full 95% of Digicel’s debt is US dollar denominated whereas 50% of revenues are either USD or from markets where the currency is pegged to the US dollar.

Bond information:

DLLTD 8.25% 9/30/2020 RegS. Issue size; $2bln. Maturity 9/30/2020 (2.05 years) sub 2 year duration. Net leverage 7.0x (up from 6.4x prior year). Recent price $69.76, current yield 11.83%, yield to maturity 39.33%. Fitch downgrade 8/24/2020 to B-, neg. outlook. It remains to be seen what the bond market reaction will be to Fitch’s downgrade of Friday past, but I suspect it will be muted. Bond CUSIP USG27631AD56.

Digicel Group Limited (DGL) debt, of which there is $3bln total outstanding is structurally subordinate to $3.7bln of debt held in 2 other Digicel entities, 2.3bln in senior unsecured Digicel Limited debt and $1.4bln in senior unsecured terms loans/revolver at DIFL (Digicel International Finance Limited).

Potential sources of refinancing:

The market is anxiously awaiting the game plan from Mr. O’Brien on the refinancing of the DLLTD 8.25%’s of 2020. The fact that the market is trading at the current level of distress (i.e. sub $70.00) may offer opportunities for restructuring Digicel. Given the large issue size of $2bln, a successful tender for the bonds at $80.00 could save Digicel $400mm. XTract Research recently released a report eluding to this possibility, but as I understand it no price indication has been proposed. One potential value catalyst noted in the XTract report (I have only seen an exerpt) is rolling in the assets of the currently unencumbered Digicel Pacific Limited entity.

-It is possible that $1.2-1.3bln of additional secured debt could be raised related Digicel entities.

-Denis O’Brien has eluded to the possibility of an equity infusion in the past. When Digicel was “rolling in clover” as they say, Mr. O’Brien took out $1.1bln in dividends from Digicel, the bulk ($950mm) in the form of a special dividend. This action (an equity infusion) would be in keeping with O’Brien’s plans to eventually IPO Digicel. Denis last attempted the IPO route in 3Q 2015, but it is doubtful he will try again before 2H2019 when leverage can be brought down to a more manageable level of 5.7x. Fitch and the other rating agencies note there is a lot to like in the competitive positioning of Digicel which operates largely in duopoly markets boasting a market share of 50% in many (not to mention 40% margins). What the rating agencies are more concerned with is the liquidity situation of the group with $158mm in cash/near cash versus an annual interest expense of $456mm, approaching 50% of EBITDA (Note: IF Digicel were a US company their interest expense would only be partially tax deductible as the 2017 Tax Cuts and Job Act caps/limits the tax deductibility of interest to 30% of EBITDA).

-Asset sales. Digicel recently effected a sale/lease back on their cell phone towers which helps at the margin, but with net proceeds < $100mm the effect is minimal in the grand scheme of things. Beyond the 450 towers covered by the sale/leaseback details have been scant of the other $400mm O’Brien has eluded to (i.e. $500mm total asset sale program).Perhaps more important is getting capex back to 14-15% of FCF from the recent highs of 21% due to heady network investments.

-Cost cutting. No further meaningful cuts are achievable as 25% of the group work force was retrenched in 2017.

Value comps: EV/EBITDA; C&W (bought Liberty) 11.2x, Columbia (bought) 9.6x, AT&T (T) 8.5x, American Mogul (AMX) 5.3x, Telefonica (TEF) 5.4x, T-Mobile (TMUS) 6.2x, Orange (ORAN) 5.6x = avg. 7.4X.

Conclusion:

The DLLTD 8.25%’s 2020 have traded as low as $62.90 in 2018. The minimum lot size for the bond issue profiled is $200k (par value), hence if one were to buy the bond at $70.00, the initial investment would be $140,000 (plus accrued interest of almost $7k), qualifying as a substantial investment for an account sized at $5mm (i.e. 3% of invested capital). Too much single name risk for me, $100k par value is more typical. JP Morgan’s EM bond ETF, ticker EMB would offer similar exposure for individual investors with more modest account size. The ETF has $13.6bln in AUM with a dividend yield of 4.62% and a ytd -5.13% return in 2018.

Digicel (B2, neg. outlook). A total return >35% is attractive, especially when compared with the paltry 7.7% yield on longer duration single B3, neg. outlook credits like TESLA (i.e. TSLA 5.3% August 2025 bonds last traded at $87.20 to yield 7.7%) which carry much higher interest rate risk (TSLA’s 5.8 year duration versus sub 2.0 year for Digicel). Tesla’s current EBITDA is -326.2mm (analysts estimate $3.2bln in EBITDA for 2019) hence a potential double headwind of EV subsidy cessation and loss of interest deductibility. Shorting TSLA is too expensive and foolhardy, but you don’t have to own it for certain.

Follow me on twitter @firehorsecaper

Safe trading. JCG

Comments »

SUB-PRIME AUTO LOANS; GET OFF THE GAS: SHORT VIA $CACC

$CACC – Credit Acceptance Corp has been in the subprime used auto loan game for a long time, since 1972. The company currently sports a market cap of $7bln (enterprise value of almost $10.5 billion, inclusive of $3.45bln in debt), with a P/E of 15 on earnings of $24* a share driving a current market price of $360. The short thesis that will be laid out in this article will be driven by a steep drop in earnings on a go forward basis due to an increase in realized credit losses. One would expect P/E multiple compression to be a factor as well, once the rally has crested.

*Tax Cuts and Jobs Act accounted for $5.10 per share in ’17 GAAP (one-time effect).

The US consumer is more heavily indebted than at any other time in history. The unemployment rate has rarely been lower at sub 4% and all states are currently sub 7%. Consumer debt stands at $12.96 trillion. Student loans are at a record $1.36 trillion, sporting an 11.2% delinquency rate (Powell put?). Auto loans outstanding stand at $1.21 trillion ($282 bln to sub prime borrowers) with worsening delinquency stats; 5.8% > 60 days (higher than through the global financial crisis where rates peaked at 5%). Underwriting standards have tightened overall, but the numbers for non-bank subprime auto are worse at just under 10% delinquent (per Equifax). As one might guess, used cars do not result in high recovery rates when things go pear shaped. 107 million Americans carry auto loans at present, +35% since 2012.

This folly can of course continue for a while longer. $CACC’s cost of debt is currently just over 4%. Their most recently completed $450mm subprime auto loan securitization (non recourse) was well received. Zerohedge recently wrote on the phenomenon “Junk in the trunk” and included the recent auto loan delinquency table. Similarly generically named (i.e. ACME Auto) Consumer Portfolio Services, Inc.  (CPSS) recently completed a $40mm securitization of their residual interests in 13 previously completed securitizations. Feed the ducks when they are quacking, indeed.

Credit Acceptance Corp (CACC) 5 year chart – a thing of beauty.

Things that should worry the bulls:

1.) Credit quality of CACC’s loan portfolio:

Similar to strategies like selling volatility, lending money on easing terms to sub-prime borrowers can be a recipe for lackluster investment returns, if not outright disaster. Credit Acceptance Corp clearly has the data to provide further stratification, but instead disclose that 95.6% of their clients are sub-prime (< 650 FICO score).

Car loan term extension. 5 year ago the average car loan was 48 months. No more …. over 40% are now 61-72 month and 32.5% are 73-84 months. Moving on to the used segment, terms have also been extended. CACC’s average loan term for advances on used cars stands at 50.4 months (almost 20% longer on a rolling 5 year basis). Cars financed at 20% interest rates do not yet easier to own with the passage on time.

2.) Shareholder Distributions:

Considerable time is spent in the annual reports of CACC on the merit of stock buybacks versus dividends.

A sample from the most recent 2017 report:

“Like any profitable business, we generate cash. Historically, we have used this cash to fund originations growth, repay debt or fund share repurchases. We have used excess capital to repurchase shares when prices are at or below our estimate of intrinsic value (which is the discounted value of future cash flows). As long as the share price is at or below intrinsic value, we prefer share repurchases to dividends for several reasons. First, repurchasing shares below intrinsic value increases the value of the remaining shares. Second, distributing capital to shareholders through a share repurchase gives shareholders the option to defer taxes by electing not to sell any of their holdings. A dividend does not allow shareholders to defer taxes in this manner. Finally, repurchasing shares enables shareholders to increase their ownership, receive cash or do both based on their individual circumstances and view of the value of a Credit Acceptance share. (They do both if the proportion of shares they sell is smaller than the ownership stake they gain through the repurchase.) A dividend does not provide similar flexibility. Since beginning our share repurchase program in mid-1999, we have repurchased approximately 33.4 million shares at a total cost of $1.6 billion. In 2017, we repurchased approximately 610,000 shares at a total cost of $123.5 million.”

It is separately disclosed that CACC is fully restricted in paying any dividends by its Lenders ($3.45bln and the Lenders get paid 1st from a priority of payment perspective). Dividends matter and CACC management can not claim to be Warren Buffett, despite the impressive track record CACC has logged. There is no portfolio effect to be relied upon in this instance. CACC finances used cars to insolvent borrowers at above market interest rates in the hopes that the net margins secured over numerous economic cycles compensates for the considerable risk assumed. Estimating the intrinsic value of CACC at any point in time is poppycock as a result. Caveat emptor, especially CACC themselves in buying their own stock. Red flag.

CACC have not repurchased shares since $220. CACC, “If we are inactive for a period, shareholders should not assume that we believe our shares are overvalued.”

3.) Management turnover:

President from 2007 Steven Jones retired mid 2017. Founder and former Chairman Don Foss has sold $450 million in CACC stock since exiting.

Car Trouble;

“They Had Created This Remarkable System for Taking Every Last Dime From Their Customers”


4.) Relative valuation comparisons:

$CACC’s  P/E of 15 seems quite punchy for a sub-prime auto lending operation. Much better diversified banks are lower; WFC 13.6X, RY 12.5X and WBC 11.7X. In the exact same space the valuation asymmetry is even more marked. Santander Consumer USA Holdings Inc. ($SE) has a similar market cap ($6.9bln) yet sports a P/E of 5.9x

GM bought AmeriCredit (ACF) for a 24% premium to the then public equity valuation in July 2010, 1 year post a $50bln bailout by the US government while still 61% owned by the US Treasury. In this space, silly can remain silly, approaching ridiculous at times.

Action plan:

Monitor Credit Acceptance Corp. ($CACC). Short interest is relatively high (12%) and the high-beta rewarding market we currently enjoy could see CACC reach towards $400 in calendar 2018 as the indices pinch higher. Remarkably, the only down month for CACC historically is October. With spot at $360 I’d think September might offer a good entry point for a short:

Spot price: $361.15

9/1/2018 projection $380 (short entry target)

Take profit (TP) $210 (I buy where CACC buys)

Stop-loss (SP) $418

Risk reward (R:R): 4.5:1

Follow me on twitter @firehorsecaper

Disclosure: Flat $CACC, monitoring for initiating a short position of 2-3% (of overall portfolio).

Caleb Gibbons

Comments »

INTEREST RATE SWAPS FOR THE MASSES – ERIS SWAP FUTURES

Few things are viewed with as much distain as US Treasuries, or more generically the “rates” market for 2018 and beyond. Finding the correct instrument to short the rates market and perhaps more importantly choosing the right tenor (target duration) is difficult for the average investor.

10 year UST sold off by 7bp today and went out yielding 2.55%, the cheapest of the year (near term target 2.625% aka 2 5/8%). Estimates are for a 3 handle and even 4% 12-18 months out. Barron’s recent poll saw 10 year UST estimates ranging from 1.95% to 3.10% with the median estimate 2.65% (not likely within the range let alone correct on a stand alone basis).

HT Patrick Burbon @pbourbon

All the “big guns” have declared open season on the long duration US rates market, it appears:

Gundlach holds the current title of bond king having built Doubleline from scratch post TCW to > $100bln in AUM in just a few years. DSL, Doubline Income Solutions is only $2bln of this AUM, but continues to impress (writer up 25% on initial purchase, 15.7% blended across two). Jeff is calling the current environment the era of quantitative tightening, driven by a hawkish ECB. Stateside Gundlach sees a US$1.9tln in 19′ bond supply (no ultralongs). He also noted that it is a very poor time to buy corporate bonds (high yield bond index yield 4.93%) and Gundlach sees a negative return for the S&P in 2018 as the rates rout eventually gives the equity market the yips. Gundlach see the 10 year UST yield getting to 3.25% in short order. Everyone seems to need to comment on bitcoin too, Jeff thinks the highs have been printed.

Bill Gross (same age as my Dad) from Janus Capital Group, who built his >$1bln wealth at Allianz’s Pimco and was the bond king ($270bln AUM at its zenith) until Gundlach wrestled it from Gross’s arthritic hands, is also a bond bear. Gross stated today that 25 year trend lines in both 5 and 10 year treasuries have been broken, signaling a bear market.

Sovereign buyers (China and Japan in the press most recently) are taking pause with respect to incremental UST purchases as the hedging costs to bring the assets back to their home currency have become prohibitive, in some cases. The big players are reticent to place large UST positions on unhedged given most are marked to market, with the degree to which they are offside promptly reported. Significant career risk indeed.

While 10 year UST closed out 2017 almost the same yield as 2016, much has transpired with respect to curvature, namely curve flattening. 5-10’s closed the year sub 0.20% (20 basis points), whereas 2-10’s went out at 0.518%, from a relatively steep 1.28% to start 2017. Best to stay clear of long bonds on any bearish bets, as term preference and relative value (versus peers like German bunds) could see yield well contained in the long end, on a relative basis (i.e. 10-30’s inverted, from +12bp currently).

While bond bears are numerous, the view in not unanimous (thankfully, one needs someone to take the other side, as it were). The California Public Employees Retirement Systems (Calpers) at $342.5bln AUM is the largest public pension fund in the USA (as social security is not funded, opting for a “pay as you go” approach). Calpers made a watershed move to INCREASE their bond allocation to 44% from 19% in November of 2017. Calper’s resultant return expectation has been lowered by 0.5% to 6.5% to reflect the more conservative asset allocation, leaving their funded status at an unimpressive 68%. Outright losses on a bond allocation of this magnitude would result in overall Calpers returns being impaired by more than 50bp, for the actuaries out there. The new allocation went into effect January 1, 2018 and changes are made every 4 years.

If you are in the bond bear camp, the next decision is your optimal means to short the bond market. There are several alternatives.ProShares UltraShort 20+ Year Treasury (TBT) has $2bln in AUM and provides an ETF solution to shorting the US treasury market. The payout is -2X the daily performance of the ICE U.S. Treasury 20+ Year Bond Index. ETFs are a fully funded solution. I am leaning towards, for tactical positioning, is interest rate swaps (paying fixed 10 year). Just as the natural inclination for the stock market in a given year is positive (approx. 65%), the natural interest rate curve is positive, as in upward sloping.

Positioning for higher interest rates via shorting treasuries or paying fixed on an interest rate swap are negative carry trades. There is a trading adage that the road to hell is paved with positive carry trades (i.e. selling vol as an example). It is important to know the mechanics of the trade you are contemplating entering. To show this by way of an example, if one were to pay fixed on $500,000 notional 10 years you would pay 2.612% in the current market. In exchange for paying fixed you receive 3 month USD Libor flat (current setting 1.70%), hence for the 1st 3 months of the interest rate swap you have a negative carry of 91.20bp (0.9120%), approx. $1,140 on $500k notional. Each 3 month forward rate agreement (FRA) going forward will reset at the then current 3 month Libor (less negative carry as Libor sets higher) and if you are correct about fed fund futures underestimating the pace of Fed rate hikes the trade will “flip” at some stage, earlier than expected by the market, to a positive carry trade as 3 month Libor sets above the fixed rate you agreed to pay at trade inception. At trade inception, the difference between the fixed rate payments committed to and the expected floating rate payments should be equal to zero (NPV=0).

Interest Rate Swap Futures 101 for IB (1)

Product_Summary (1)

Interactive Brokers (IB) is now offering ERIS swap futures platform access to their 400k + person account base. This is an exciting development as the margin requirements are modest and there is no better way to replicate over the counter (otc) swaps available in the market at present. The uses are varied; those in an adjustable rate mortgage (ARM) can potentially hedge their interest rate risk for much cheaper than a refinancing. Those long credit with concerns about the rate market can hedge their rate exposure, creating synthetic floating rate notes (FRNs). Those looking to speculate of further a further sell-off in the rates market can participate with surgical financial precision. Trading hours are New York, but this is to be expected for a US dominated product. Most would hedge in New York hours regardless, but stops could be executed cross market in a pinch (i.e. buy 10 year Treasury to hedge a stop loss on a pay fixed swap position).

Follow me on twitter @firehorsecaper

JCG

Comments »

PUTIN’S LONG ARM – CORE VENEZUELA ENERGY ASSETS UNDER RUSSIAN CONTROL

While much of the US populace navel gaze over “he said, he said”, rear view mirror stuff with the 2016 US Presidential appointments/elections, real world carnage is taking place, in real time. Venezuela’s communist government slinky has run out of gravity and steps, falling at the feet of mother Russia. Venezuela has defaulted on $60bln of debt, officially termed “selective default” at present by the rating agencies. Russia is not sure what all the noise is about as their bi-lateral payments have been made on a full and timely basis? Ditto for China.

Caracas is 3,317 miles from Washington, versus the 4,861 miles from Moscow to Washington, DC (and much closer to key US energy assets in the Gulf of Mexico). Beijing is 11,158 miles fromWashington, for reference. Russia/China having strategic energy assets so close to the US should be a point of concern both for the current administration and for the bigger US GOM refiners. Billions of US dollars are flowing into Venezuela from Russia and China, along with a brain trust of skilled workers numbering in the thousands to ensure both execution and return bogeys are met. Russian war ships are on the way to Venezuela as we speak, a strong sign of Russia’s support for the struggling communist nation and the “financial aid” Russia has extended. Putin must have a good giggle daily at having a South American domiciled Ukraine-like foothold without an argument, let alone a public conflict with the US (for now). Back in August, Trump stated publicly that he could not rule out a military option with respect to dealing with the struggling South American nation.

Venezuela has a population of 31.6 million, about 15% less than Canada’s. Venezuela boast the largest conventional oil reserves and the second largest natural gas reserves in the Western Hemisphere. Venezuela’s non-conventional deposits are approximately equivalent to the world’s reserves of conventional oil. The majority of Venezuela’s domestic energy needs are met with hydroelectric power.

Bahrain has requested assistance from neighboring Saudi Arabia and UAE. Saudi Arabia has taken a page out of Brazil’s playbook with “Car Wash 2.0” anti-corruption crackdown. Zimbabwe overnight has seen a coup. Fun times to have the VIX in the low teems (12.6, up 9%). Sovereign EM is not the only story here as EM corporates are the ones with the more heady issuance of late, US$8bln a week at the  most recently clip. IG EM US$ bonds returns have been stellar thus far in calendar 2017 with 5 nations clocking > 10% returns year to date; Uruguay, Panama, Peru, Mexico and Kazakhstan. So much room to fall from here. Not a sky is falling comment, buy many assets are priced for perfection when we have blemished prospects for continued/further levity.

Back to Venezuela, recovery rates are very hard to handicap in EM credit, especially when the key assets that would result is some recovery have been sold to Russia and China respectively. VENZ, sovereign rating “D” standing for default,  (bond ticker, Benz with a V) 7% 1 December 2018 sold off 40% to trade $32/$35, (seems high given scant recovery prospects). Plenty of info in the popular press on the “deals” that have been struck between Petroleos de Venezuela (PDVSA) and Russia’s Rosneft in the run up to Maduro’s most recent restructuring  announcement.

The pace of EM bond issuance will be greatly curtailed, if not ceased near term. The US$ EM bond craze we have seen evident since the GFC has seen US$3 trillion of new debt issued. Little wonder high yield ETF’s have taken a knee in recent sessions, the dry heaves are coming. Calpers most recent tactical asset allocation back into bonds from DM equity will not be soon enough or far enough down the ratings spectrum to provide an air bag for the coming head on collision.

Venezuela, for their part, have been very critical of the rating agencies, “”In the last 36 months, Venezuela has canceled, for the concept of Reimbursed Capital and Paid Interest, the amount of $ 73.35 billion, an immediate consequence of each payment and each compliance has been the increase of country risk by rating agencies risk, which have been deeply inefficient to prevent scandalous financial setbacks in financial power centers in the United States, Europe, and Asia, but which are used as an instrument of devious action against our country: the more we have paid, even though we have always been timely in honoring our payments, risk rating agencies, following the pattern of financial blockade undertaken by the Trump Administration, makes it expensive with reports devoid of any form of rigor and veracity, the cost of our debt and intervene to hinder Venezuela in its condition of good payer and solvent country, access to external financing, common and frequent for almost all countries of the world”

Only 2 non muslims nations are included in Trump’s most recent travel ban. North Korea and Venezuela. Good luck getting plug nickel out of Venezuela near term if you are a US$ bond holder. Dalio’s call on gold, increasing his weighting significantly, seems precient. A number of geopolitical fuses have been lit, we just don’t know which one goes boom first.

Credit wider, bond steady / curve to stabilize, equity vol to spike, global equities softer, gold firmer.

Follow me on twitter @firehorsecaper

Don’t forget, cash is an option from an asset allocation perspective.

JCG

Comments »

MUNI DEBT: SALT IN THE WOUND FOR HIGH TAX STATES

tRump’s GOP tax plan is not sitting well with the high tax, blue leaning states of California (11.4% rate for State and Local Taxes, aka SALT), Connecticut (11.4% SALT), New York (12.6%) and New Jersey (12.3%). These four states account for 22% of the US population and 23% of US GDP. I frankly expected a higher percentage GDP wise, with so much of the vast contiguous states dedicated to energy production (1000 gallons a second in demand) and animal husbandry (9 ounces a day per capita).

With the proposed changes to the US tax code, removing the deduction of SALT payments from ones Federal tax bill going forward, the effective tax rate for the wealthy will be increasing significantly on passage of the bill in close to its current form. This will greatly enhance the attractiveness of municipal debt and has resulted in a stonking rally in muni bonds this week. Early innings with respect to the rally, unless the federal deduction for SALT survives in the final drafting. Rolling back SALT deductions offsets approx. 1/3 of the $1.3tln “hole in the bucket” left by the proposed GOP corporate and individual tax cuts (largely paid for by the 3% resultant GDP growth). The rally moves in muni credit will likely be muted on the heels of the ongoing Puerto Rico default/debacle, hence there is time to put in the work and do the analysis required to come up with a rational investment decision.

https://ibankcoin.com/firehorsecaper/2016/04/10/puerto-rico-the-spoils-of-war/#sthash.uTYSeX6D.dpbs

The initial read of Trump’s tax reform plans appeared to be hemlock for muni debt, driven largely by lower absolute tax rates, with the highest 39.6% (solo income >$418.4k, joint filer >$470.7k) bracket moving to 33%. With key tweaks to the tax reform plan on the deductions side, as many as 25.5% of taxpayers could see their taxes increase from current levels under the currently tabled tax reform plan. It appears the 39.6% bracket will likely be kept for those earning above 7 figures.

As an aside, NJ, post election, is expected to re-institute the millionaire tax for resident making > $1mm (2% effective surcharge on income > 1mm). In addition to the egregious existing taxes NJ levies, for no good reason other than winning geographic roulette in being commutable to NYC, one should expect a portion of NJ’s millionaires (7% of the population on net worth metric, much lower % on income) to pull up stake, taking a page out of Tepper (formerly #1 NJ taxpayer, now in Florida) playbook. With nine states credit watch negative, including NJ, a betting man would place odds on more downgrades than upgrades going forward.

For muni bond investors in the 4 high tax states profiled, there are a bevy of state specific funds that cater you your investment needs, if purchasing bespoke muni bonds is beyond your ken. The advent of on-line trading platforms is improving the state of play, but the bid/offer spreads on muni bonds is high, both outright and compared to taxable peers.

https://www.marketaxess.com/trading/municipal-bonds.php

Two funds with comparable scale and liquidity are BlackRock Muni Holdings New Jersey Quality Fund, Inc. ,MUJ  and Nuveen New Jersey Quality Municipal Income Fund, NXJ. The big daddy is a Vanguard offering, 4x bigger at $2bln +; Vanguard NJ Long-Term Tax-Exempt Inv., VNJTX, yielding 3.46% (Federal and NJ tax exempt) which may seem paltry, until you calculate the taxable equivalent basis (TEB). Speaking to investment income, a NJ taxpayer in the top tax bracket in all categories pays 39.6% in Federal tax, 8.97% in direct NJ State Tax and Obamacare 3.8% tax on investment income (muni bonds are exempt). Adding up this stack gets you to 52.4% in taxes, coincidentally the same as the Province of Ontario in Canada (ditto on distress, save the pension funding shortfall issue).  Vanguard, and other veritable institutional investors have online calculators for TEB for those not mathematically inclined.

In my rudimentary NJ example, the VNJTX yield is 3.46% and the denominator is 0.476, resulting in a taxable equiv. yield of 7.27%. A quick perusal of global fixed income markets will find many gobsmacked to realize how high a 7% taxable yield is in the current environment.

US state pensions remain woefully underfunded in aggregate (70% funding rate, > $1 tln unfunded) and the public pension gravy train keeps on chugging, at least for now. Even for a $18 trillion dollar US economy, so many debt tallies in the trillion plus club should give the non-billionaire adults in the room cause for pause, if not reflection. Student loan debt; $1.3 tln, auto loans $1.2 tln and credit card debt (“revolving”, at least in theory) $1.1 tln. Those reticent to buy NJ domiciled muni debt and or NJ dedicated funds can of course give NJ a wide berth from an investment perspective. The rub is that your tax exempt muni yield will be only federal tax exempt, not state tax exempt. Following on my previous NJ example, your TEB (aka, your taxable basis “bogey”) becomes 6.11% instead of 7.27%.

The same analysis should be done for potential muni investors in “the big 4”, NNCC, as you are spoiled for choice in terms of muni debt and/or state specific funds (mutual, closed-end and ETF forms) to choose from.

When things get really interesting, “cross over” buyers, those that can not use the US tax exemption, find it compelling to buy US muni credit versus other investment options available in their home market. I’m a holder of BlackRock Taxable Municipal Bond Trust, BBN in my IRA (the underlying bonds are taxable hence distributions, currently yield 6.75% is taxable in non tax sheltered accounts). Pension obligation bonds, issued by states attempting to improve their pension funding % (in lieu of also paring benefits, which other countries do on a near 50/50 basis, until fully “funded” from an actuarial perspective) are also taxable.

With equities “off the leash”and vol compressed due to medicated markets, munis have a valid place in the asset allocation for US taxable investors (likely a multiple of gold and/or crypto). The US municipal bond tax exemption is one of the few near-free lunches on offer in global investable fixed income markets.

Keen to address any questions, as I know this space well. Follow me on twitter @firehorsecaper. Good to be back.

Caleb Gibbons, CFA

Comments »

BARINGS BANK REDUX: SANTANDER BUYS BANCO POPULAR FOR €1.

Barings Bank was sold for £1 to ING back in 1995, but the comp is close one has to admit.

Spanish regulators red carded Banco Popular, selling them to Banco Santander for €1 (US$1.13). The mechanics of a resolution mechanism provide us with a potential road map for the future. It appears subordinated bond investors were not charging enough for the tail risk being assumed.

Santander press release:

“07/06/2017

Banco Santander today announces that it has acquired Banco Popular. The acquisition takes place following an auction conducted by the Single Resolution Board and FROB in which Santander was selected as the successful bidder, paying a notional consideration of €1. As part of the transaction Santander will complete a rights issue for a total amount of €7 billion. This will cover the capital and provisions required to strengthen Popular’s balance sheet. Existing shareholders will be given preferential subscription rights. The rights issue is underwritten.”

The focus of the popular press (pun intended) has focused on the equity component of the capital structure, but the real story has been on the debt components, both senior and subordinated.

Along with the common equity, as one would expect with an outright sale at €1, addition tier 1 (AT1) bonds have been totally cancelled (traded high $50’s $ price to effectively zero). Tier 2 Popular subordinated bonds have been voided through conversion to equity @ €1 (in totality, along with existing common shareholders). Senior debt has been protected in this scenario, with the 2’s of 2020 trading up $12 to $102, at the time of publication.

Look for other challenged issuers’ AT1 bonds to “adjust” to this news (read: not higher in price) over time, although initial reactions appear to be muted.

Follow me on Twitter @firehorsecaper JCG

Comments »

ILLINOIS GO’s (Baa3/BBB-): JULY FIREWORKS AHEAD; JUNK SALE LIKELY

Illinois is in a serious bind. The road to perdition has been well lit, and signposted. 8 downgrades in 8 years for the General Obligation (GO) liabilities of the state, with another drop down to junk likely as soon as July 1st, the beginning of their 2018 “fiscal” year. Moody’s and S&P last moved June 1st taking the GO ratings to 1 notch above junk with the ominous warning that they will not be timid if further downgrades are in order. Illinois remains with a negative outlook and on negative watch with both major rating agencies. The unfunded pension liability of Illinois’ five state plans now exceeds US$130bln. IL State now has the lowest funded pension percentage (ranging from 37.5% to 44.2%) of all 50 states. All 5 plans have been achieving investment results well shy of their actuarial assumptions, the most prominent, State Employees’ Retirement System of Illinois (SERS) by -1.75%, returning 5.5% versus a 7.25% bogey (reduced modestly in 2013).

Each Illinois taxpayer is on the hook for almost $50,000 in unfunded liabilities (pensions and post retirement health benefits). Illinois is the 5th most populated state in the union at 12,800,000, for reference. Same ranking for income (for now). Illinois has proposed a 20% privilege tax on investment management services (read; hedge funds) which was tabled in February 2017, approved by the House Revenue and Finance Committee in March and if enacted becomes effective July 1, 2017. The taxation of carried interest is highly topical at both the Federal and State level presently with both NY and NJ considering similar legislation (CT and FL are gladly accepting hedge fund refugees at the time of publication).

In addition to the pension woes, Illinois has not passed a balanced budget for 3 years in a row, as required under their constitution. This has resulted in the untenable situation whereby the state has accumulated $14.5bln in “accounts payable”, on which they will owe $800mm in interest and fees as of June 30, 2017. The cascade effect (i.e. it rolls down hill) has been very damaging. Chicago Public Schools (CPS) are owed nearly 1/2 billion from the state ($467mm to be exact) and must resort to “Grant Anticipation Notes” to bridge the funding gap created. CPS are hoping to keep the cost below 8% which is the usury cap in effect for some school budgets. Chicago accounts for a full 20% of K-12 (Kindergarten through grade 12) enrollment but a more modest 15% of the IL state budget. Laughably, the Chicago teachers are not covered by the state Teachers Retirement System. Chicago Teachers Pension Fund (CTPF) is also a basket case, as you might surmise and in addition to a number of other issues led Illinois’s largest city to be downgraded to junk status in May 2015.

Bond investors have taken note. Spreads on Illinois debt to MMD (Municipal Market Data, the yield curve of the highest rated, AAA/Aaa  municipal bonds, as published by Thompson Reuters) have widened. The eventual downgrade to junk, aka non-investment grade, will make IL debt ineligible for investment for some of their major institutional investors (one of which has already called for a boycott of Illinois debt) which are restricted by mandate to purchase only investment grade muni bonds. There are of course high yield muni funds, but they tend to be smaller in terms of AUM and have had some performance hiccups (Puerto Rico) which have curtailed investor inflows. Suffice it to say there will be more sellers than buyers on a downgrade to junk status for Illinois.

Municipal investors are a conservative bunch. Not a lot of crypo-currency investors in this lot. They are typically older investors in the highest Federal tax brackets (39.6% & 35%), let’s call them the 3%. An increasing portion of muni bond portfolios are Separately Managed Accounts (SMA’s), but the majority are still via mutual funds and closed end funds. ETF’s have made some inroads, but modest in market share terms. 10 year Illinois debt is yielding approximately 4.3% (Federal tax exempt, State tax exempt for IL taxpayers and not subject to 3.8% Obamacare investment tax). Converting this to a TEB (Taxable Equivalent Basis) a non-IL resident in the top tax bracket would need to invest in a corporate bond yielding 7.6% to match. Note: HYG the $20bln high yield ETF yields 5.13% in comparison, hence you might need to buy an out of favor sector like bricks and mortar retail, otherwise non-rated is likely where you will find >7% in the US domestic bond market.

The same negatives that sent Puerto Rico (importantly not a State, technically a Protectorate https://ibankcoin.com/firehorsecaper/2016/04/10/puerto-rico-the-spoils-of-war/) on tilt recently are evident in Illinois as well, namely rampant crime and failing schools. Many schools are years behind in even tabulating scoring tests, which would be required to confirm their bottom quartile performance. To rival the record for shootings in Chi-town you have to go very far afield to places like Kabul.

Kentucky born Lincoln might hide the other half of his face if he were privy to the folly that has befallen “Land of Lincoln”.

Tread lightly, tread carefully. This is July business, post downgrade to junk for the GO credit. Remember, the highest yielding bond is often not the best “value”. Cross-over buyers that can not readily utilize the US Federal tax exemption (i.e.; foreigners, hedge funds) might look to the Build Illinois Sales Tax Revenue Bond which offers enhanced security (and ratings) from the dedicated sales tax pledge (This was also the thought with PR’s COFINA bonds which interest was recently suspended on by the courts, but you get the idea). The PO’s (Pension Obligation) bonds of Illinois are also taxable and will likely swoon a bit on a GO downgrade to junk status. Those looking to structured deals can vet Illinois tobacco settlement bond “Railsplitter” which was structurally superior on issue in 2012 as it could withstand smoking cessation rates of 4% wrt debt service (over $55bln of tobacco bonds have been issued across all 50 states).

Follow me on Twitter @firehorsecaper JCG

Comments »