I must apologize for the reduced content over the past week and a half.
The SS ElizaMae had been running on “full steam” since early October, and last week, it finally caught up with ‘her’.
The hierarchy of needs (yes Maslow) was as follows: Family, Job, “ElizaMae”, rest in that order. Now (unfortunately) “rest” is in the hole with “ElizaMae” batting cleanup.
Notice “exercise” is nowhere to be found on that list.
I used to swim in high school…I was pretty good, our team was GREAT. Good enough to get scholarship offers from Div II schools or I could walk-on at D-I. I (moronically, as it would turn out) chose the latter. The stark change in character from my high school team to my college team was remarkable. I was a lowly peon on that team, but I went crazy after we were destroyed by North Carolina (a much better team, mind you). No one cared that we lost. I just couldn’t figure that mindset out. We lost 2 dual meets in 4 years of high school and my college career starts 0-2….AND NO ONE CARES?? It was all downhill for me from there as I had “resigned” my status as a student at that university after a grand total of three semesters.
Luckily by that time I had met a girl and started to get things put back together. Now that I think about it, this also coincides with when I became interested in “trading the market”…January 1998…first it was commodity futures…lol.
I sucked. I didn’t know what the hell I was doing.
I do recall having “Beautiful Mind” style wire-bound notebooks filled with O/H/L/C data for a bunch of different commodities. This was before someone like me could get charts on the internet…so I would record this information and try to find patterns. I was never profitable, but I certainly got the itch.
I knew that I liked the idea of how the fluctuation in price of “X” was a representation of human behavior (specifically related to how that translates to a visual form, i.e., a chart).
There are an infinite number of ways to visually analyze the behavior of a stock, that’s why I present my charts as unadorned as possible. Moving averages, oscillators, bands, etc are all reflections of either price or volume…so that is what you get from my charts (ok, to be fair I do include the void boundaries and my “watch price”…).
I guess that was a roundabout way of saying: “here is a new Top 10 list”
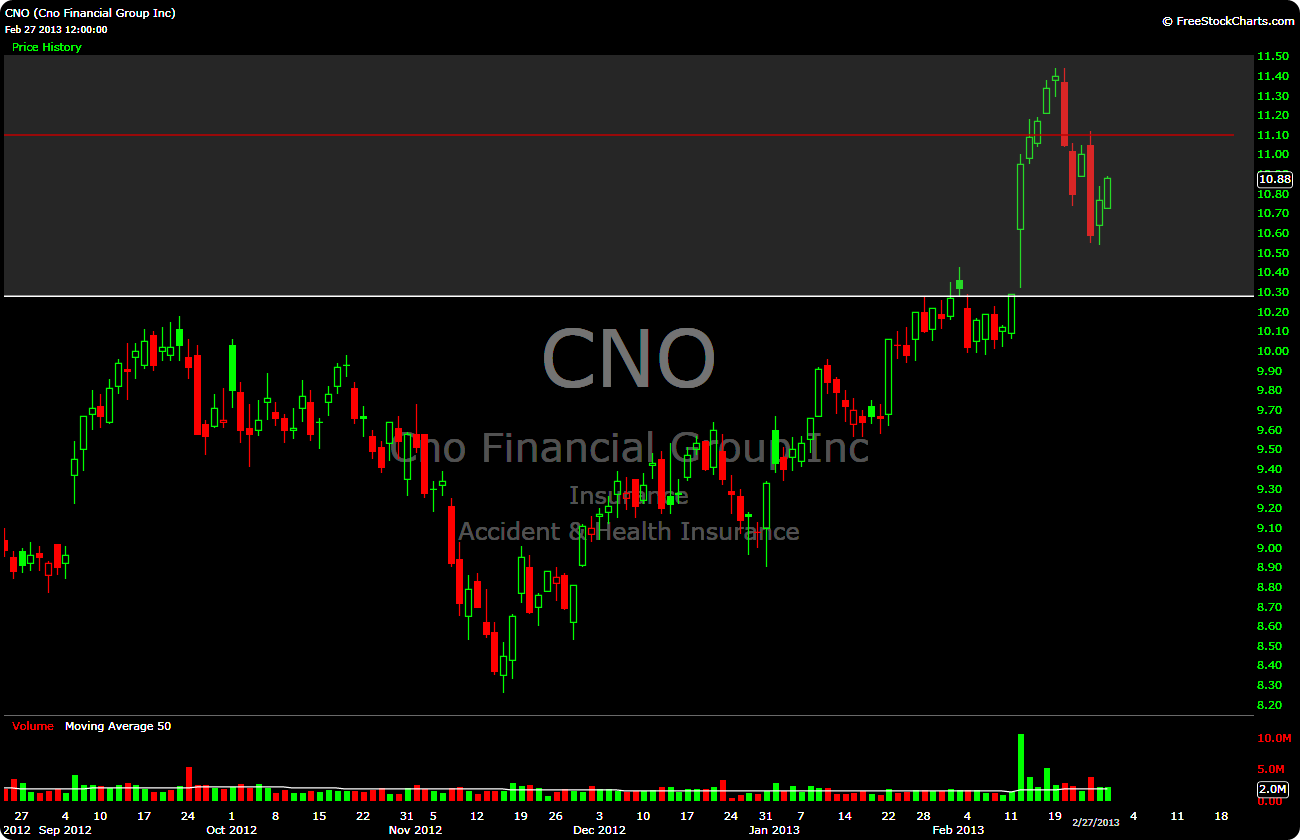
10. CNO, 11.10
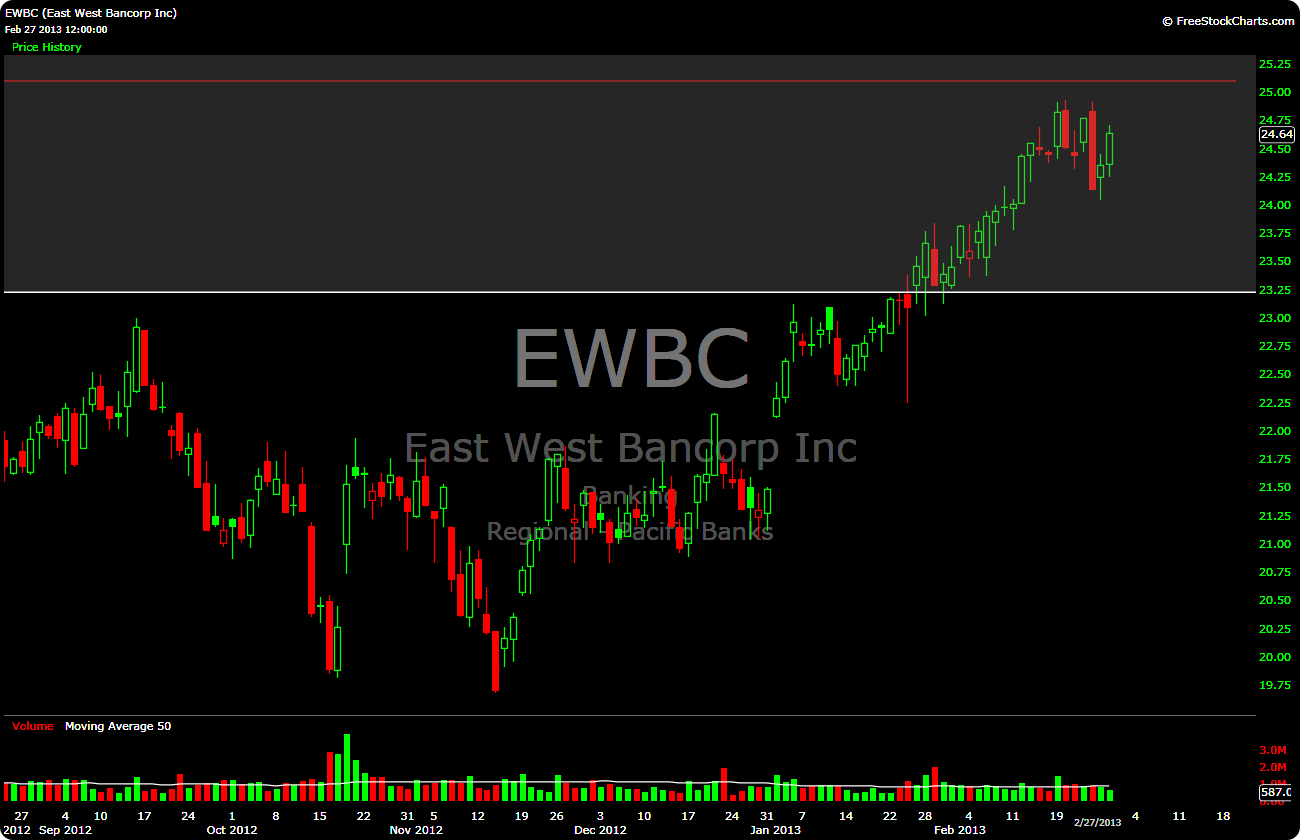
9. EWBC, 25.10
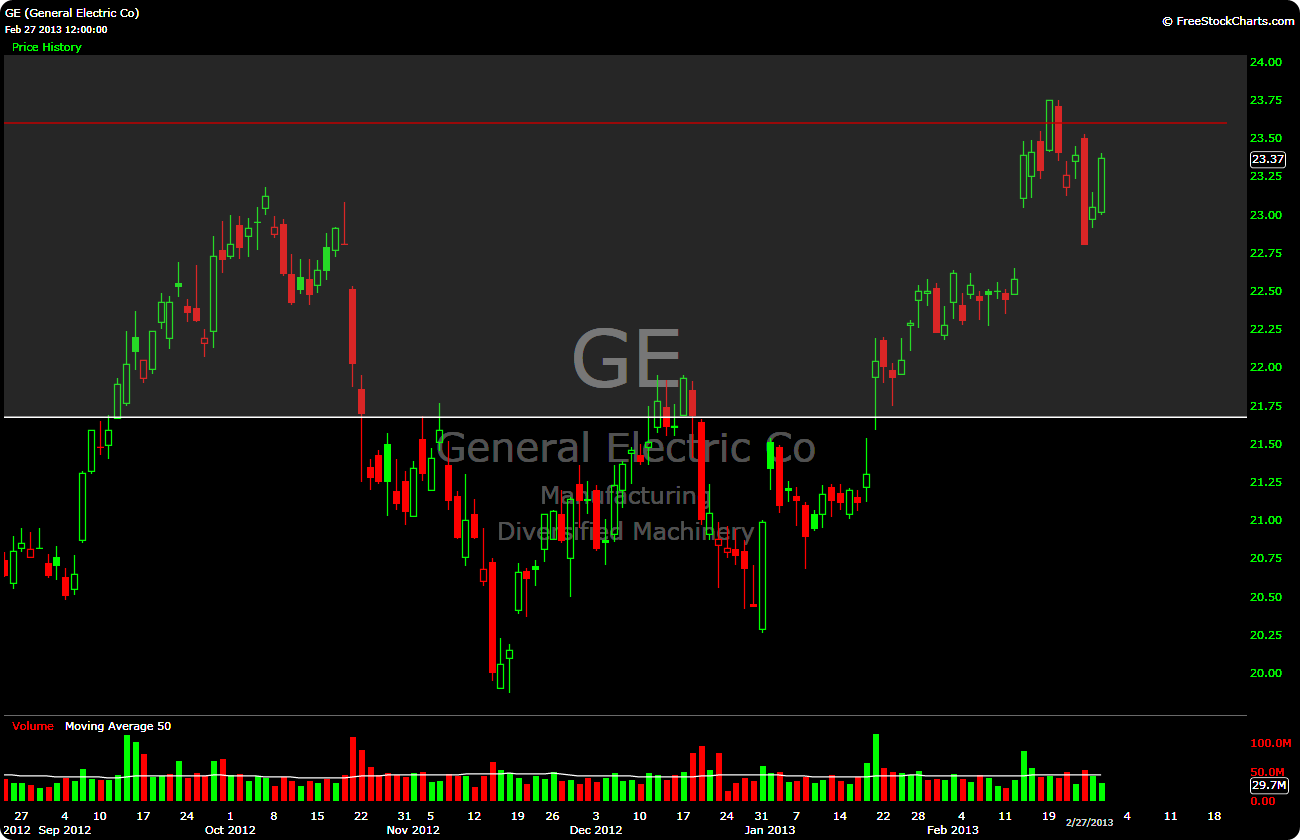
8. GE, 23.60
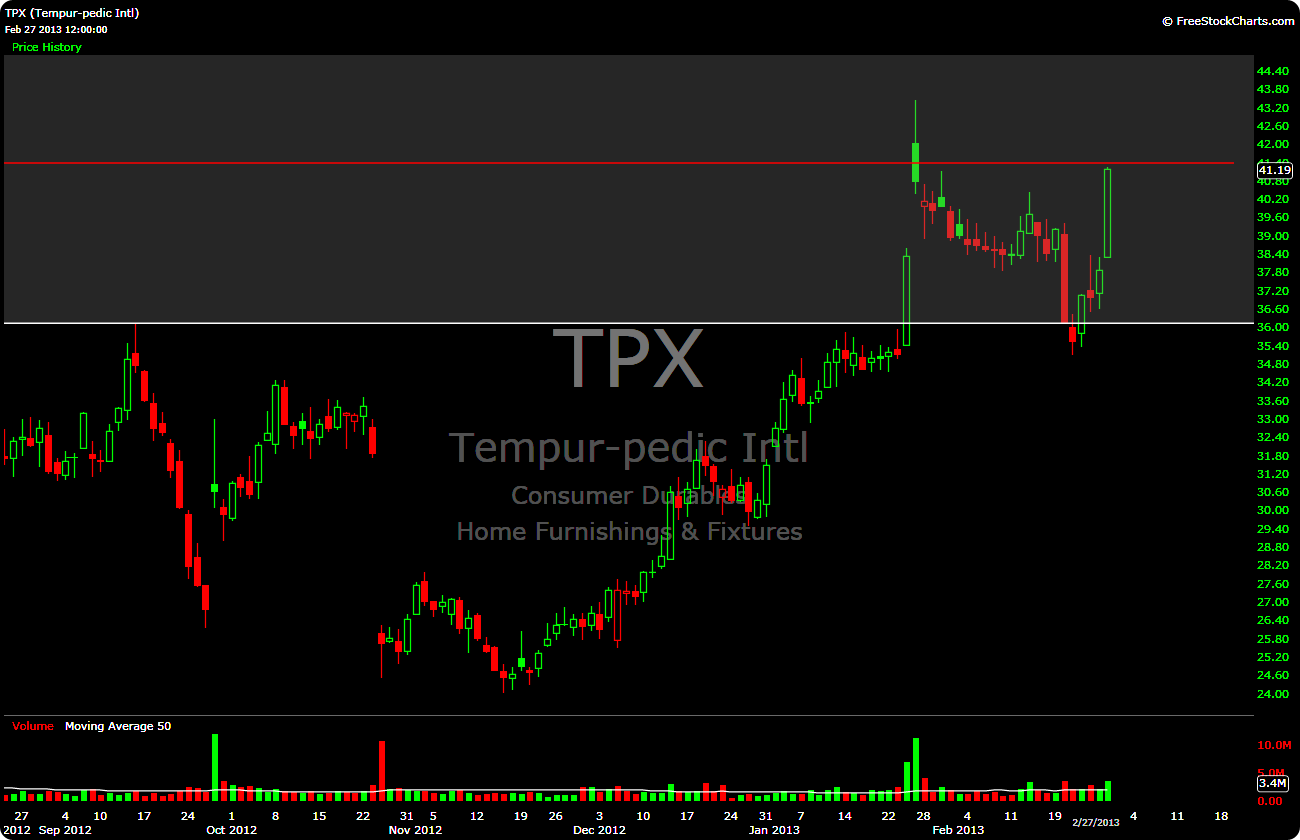
7. TPX, 41.40
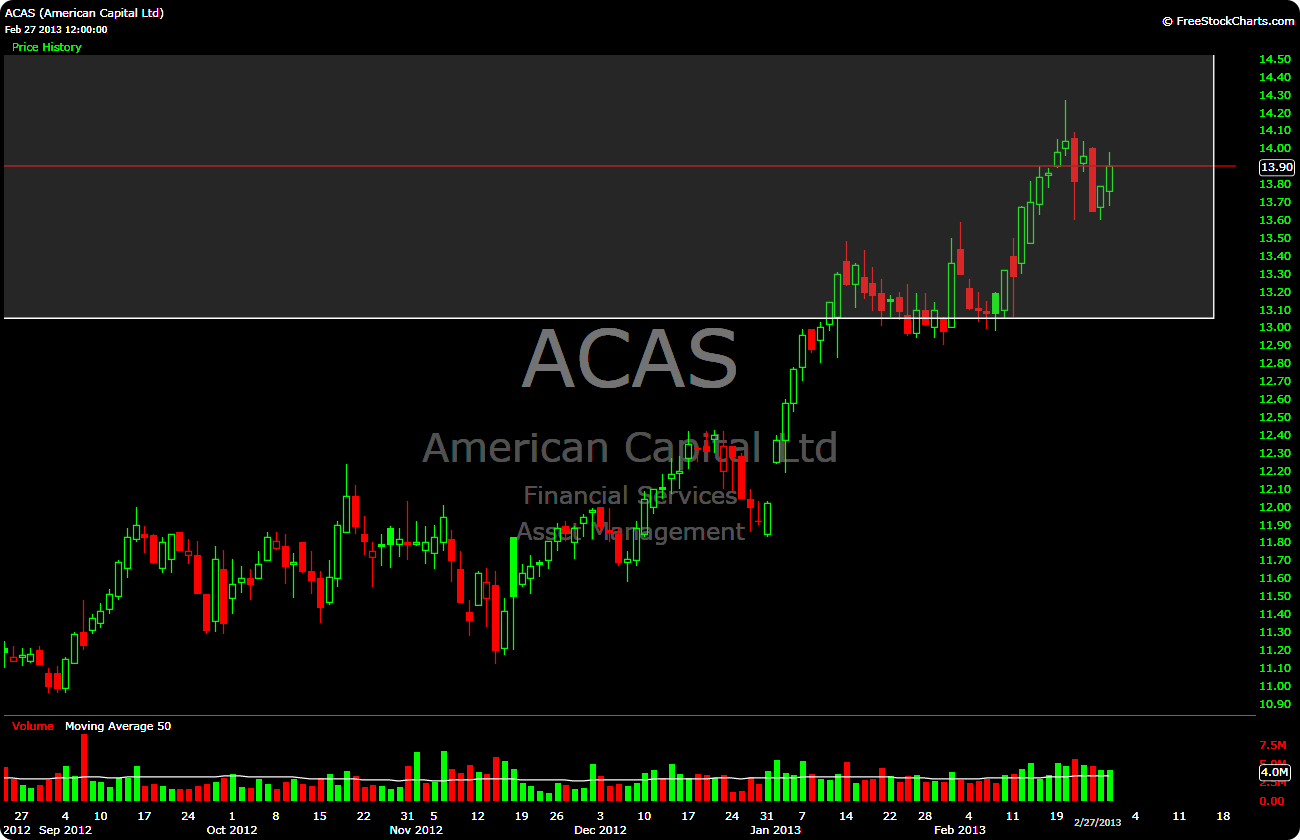
6. ACAS, 13.90
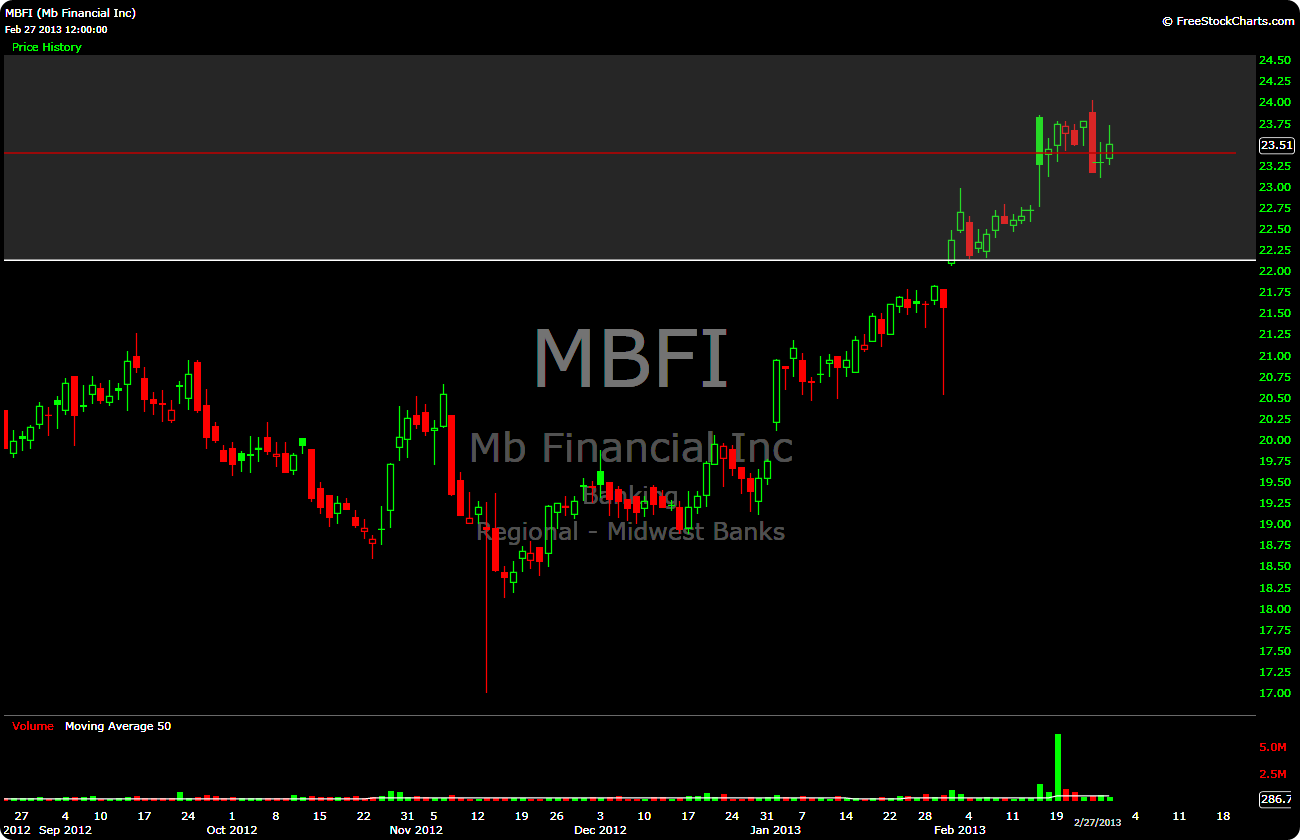
5. MBFI, 23.40
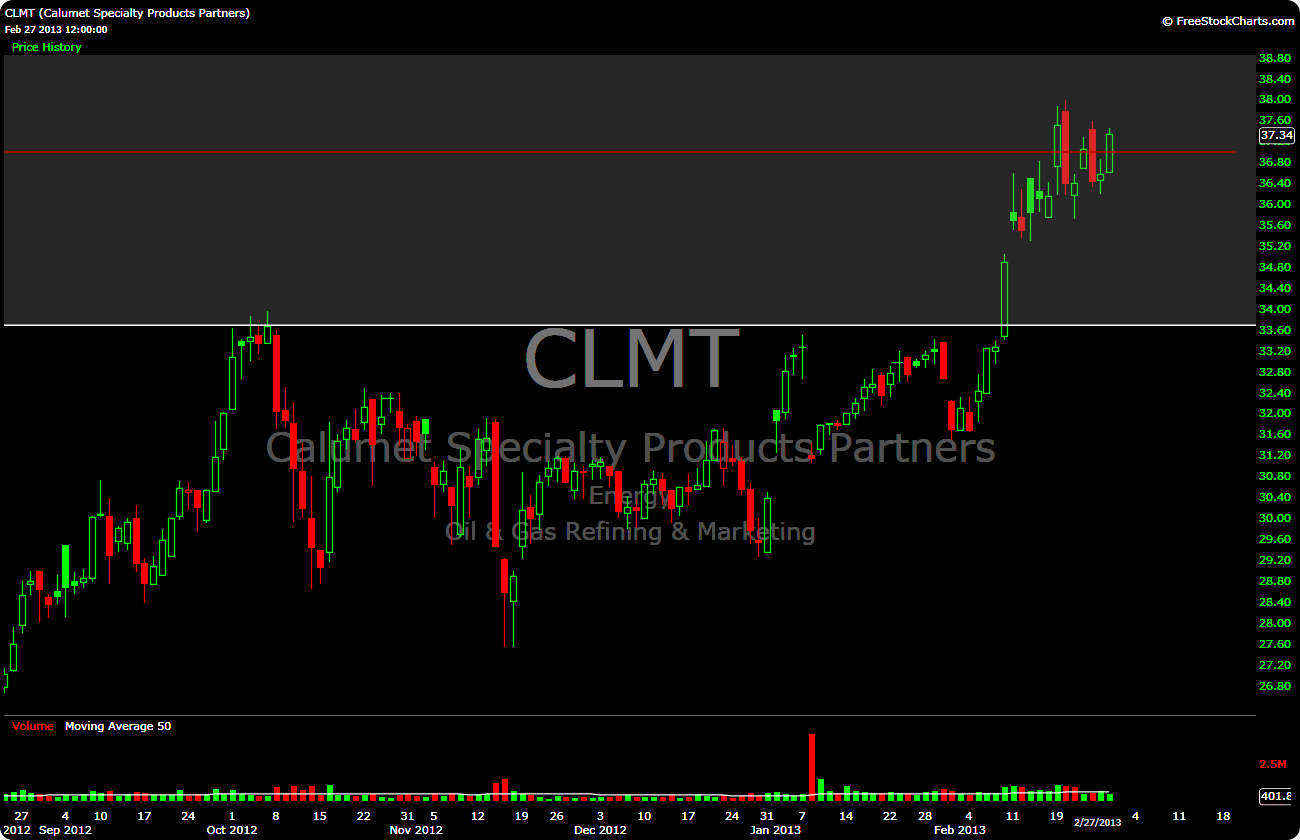
4. CLMT, 37.00
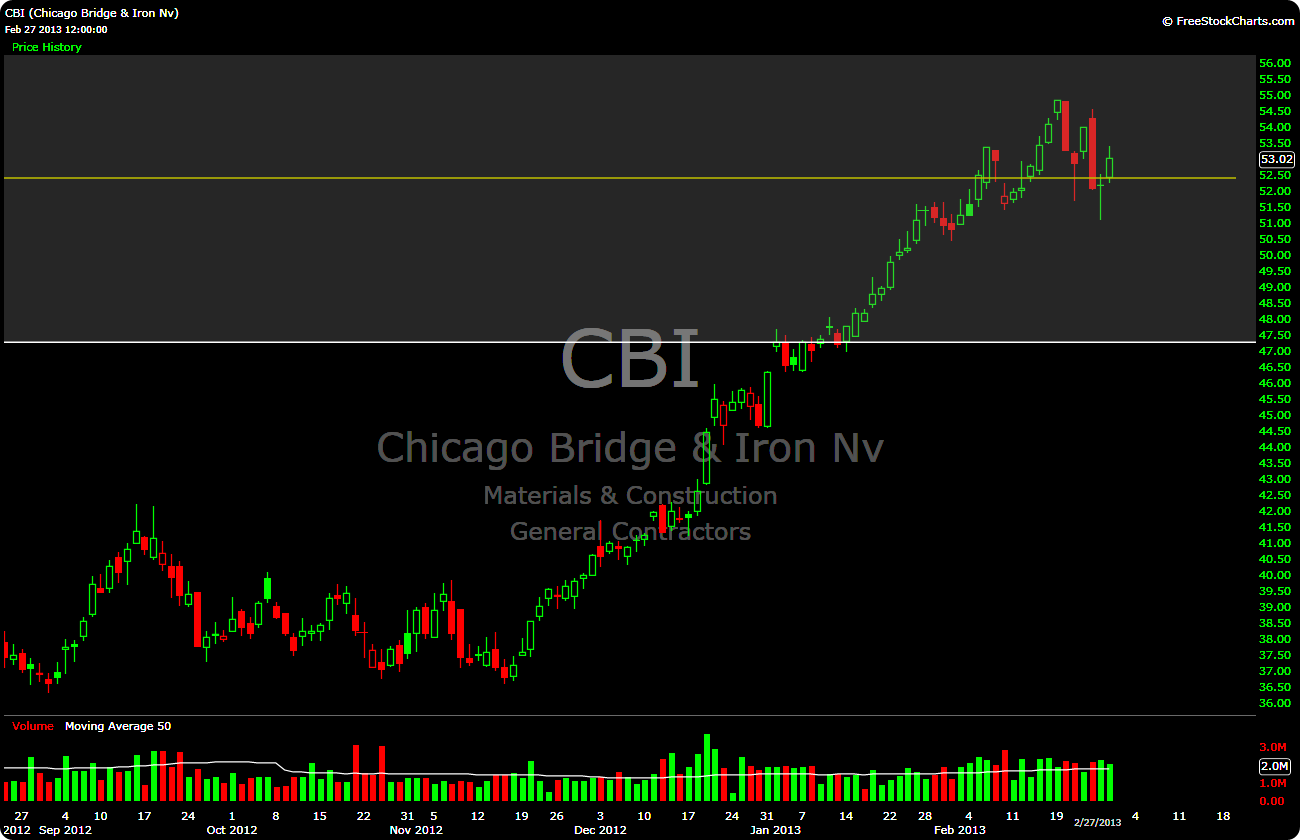
3. CBI, 52.40
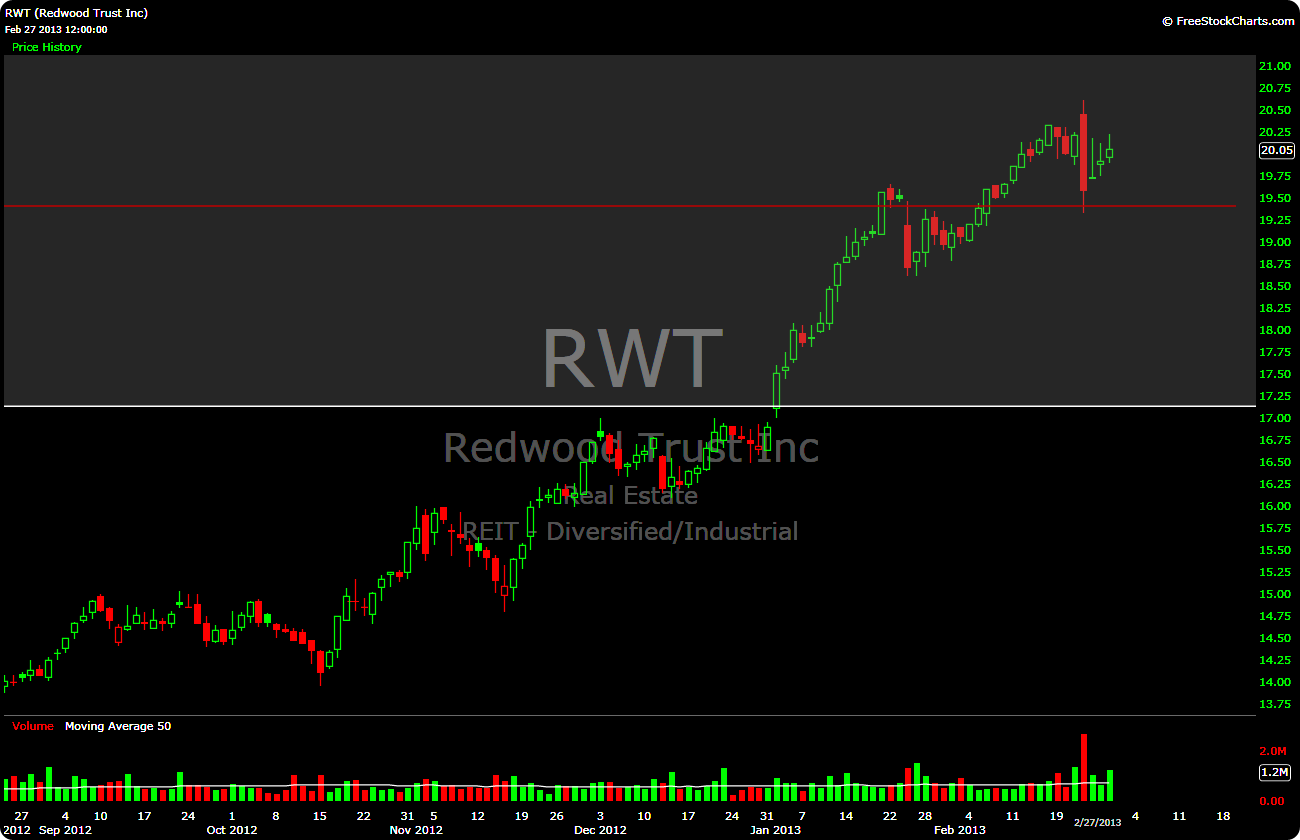
2. RWT, 19.40
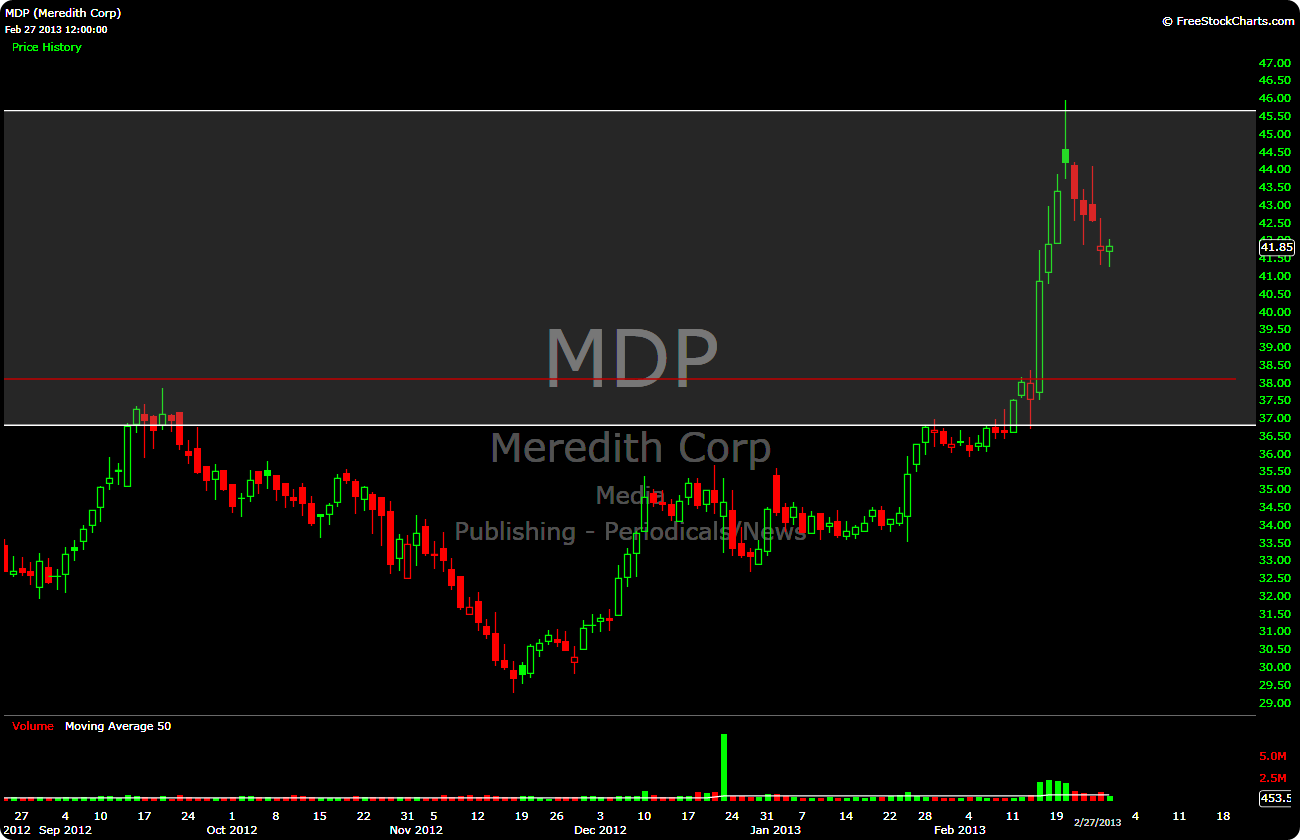
1. MDP, 38.10
-EM


4 Responses to “Checking in From the Void”
DJMarcus
TPX~
Vertigo
Where are the volume by price bars?
elizamae
I only show those on the weeklies, these are daily charts. I usually upload the weeklies to chartpin, but haven’t done so this week.
Vertigo
GE looks great, resisted the gap fill, too