On Monday (it sure felt like a Friday…) prior to the close I posted that I was taking a 30% position in EEM. I’d like to take this opportunity to clarify my procedure for this cash deployment. This system is purely quantitative…no charts, no “stop-loss”.
In effect it is primarily a binary system, where if A happens: go long, if B: go to cash. There are subsets of function A, which I will talk about later, but I’ll delve into the binary workings of it here.
This idea started a few years ago when I was trying to devise a system to take a lot of the guesswork out of investing in a 401k, while trying to reduce the drawdowns associated with just throwing your money into an S&P 500 index fund and letting it ride.
After many hours of spending time in the computer lab analyzing the results of this system (instead of doing engineering problem sets), I discovered that I could use the relationship between SHY and SPY as my “trigger”.
Using Excel, I calculate two (2) different scores on 2 separate timeframes. I compute an “alpha score” that takes the performance of one security (lets continue to use SHY in this example) versus a benchmark (SPY). I quantify this score over 21 days (1 month) and 63 days (3 months/1 quarter). I add these two scores together to obtain an “alpha score”.
The other metric that I calculate I consider a “beta score”. This beta score is a bit more involved, but essentially the math is as follows: it creates a score using the performance of a particular security (over the two timeframes mentioned above, separately, of course) (we’ll call this “a”) – “risk free rate of return” (“b”). So, we have (a-b). Then I take the standard deviation of the security of interest over the same two timeframes (“c”) divided by the simple moving average over the same timeframes (“d”). Hence (c/d). I then calculate “beta score” through the following calculation: ((a-b)/(c/d)). For those who are interested, this is very similar to how the “sharpe ratio” is calculated. Anyway, 63-day and 21-day beta scores are obtained. I add these together.
Then I add “alpha score” + “beta score” to obtain a “total score”.
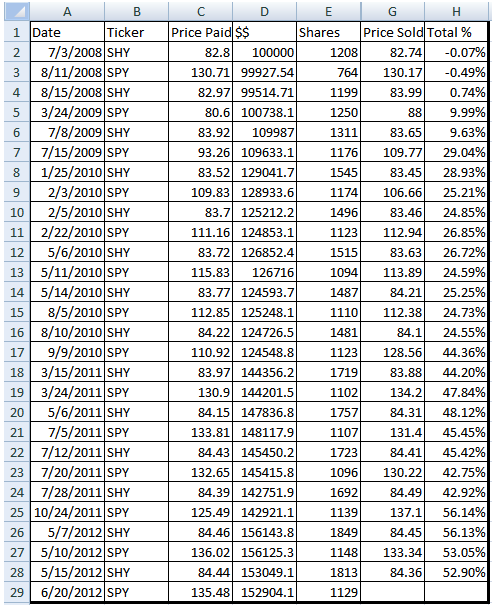
If the “total score” on SHY is under 0 I consider this “green” over 0, this is “red”. Last summer I wrote a post detailing this system using strictly SHY and SPY as investment vehicles with the following results (I apologize for the lack of updated data…in due time):
The system I am using adds a few additional wrinkles that a) rebalances assets every 21 days to the highest “scoring” ETF and b) scales into and out of positions based on “days red/days green” using the SHY trigger mentioned above. I’ll be sure to delve deeper into those aspects in future posts.
For now, we are (obviously) solidly GREEN…so let it ride.
For what it’s worth, I’m banging this post out without doing much revision, so if you have questions, I’ll be more than happy to entertain them in the comments section.
Happy New Year to everyone.
My best to you all.
-EM


