iBankCoin
Joined Jan 1, 1970
41 Blog Posts

Finis.

cahfinal

Image: Propery of Bill Watterson

My three months as a tabbed blogger on iBankcoin come to an end today. It has been a pleasure writing again on iBC and I hope those who have read this tab have come away with a better understanding of the relationship between the weather and the market, just weather, just the market, or at least the meteorological rational behind the unfortunate lack of hurricanes this summer.

I would apologize for that if I could, but we will just have to take it up with the Weather Gods when we get up there. Compared to  last summer when it seemed we were getting hurricane plays every week, blogging during the summer of 2009 has been the meteorological equivalent to offering trading advice on 90 consecutive Labor Days, Columbus Days, or whatever other silly stock market holidays there are. In other words, it’s rather difficult to make money when your market isn’t open for business. Don’t say I didn’t warn you–In my first post this summer, I remarked that “the 2009 hurricane season is going to blow if you are a fan of death and destruction and rock if you have a house out on Key West.”

That being said, I, like many traders on iBC, had a stellar summer. My best call was likely the decision in mid-August to dump my largest position, the Natural Gas Fund (UNG), as it showed signs of de-coupling from the commodity it tracked, for a <5% loss and using the assets to buy a truckload load of Chesapeake Energy, which I am still holding up 40%. Since June, I am up roughly 25% on my portfolio.

I leave you with both a few short Short-Term thoughts and a few longer Longer-Term thoughts.

Short Term Thoughts

  • Hurricane season is NOT over. I still expect we will see another 2-3 named storms, although the chance of any of these affecting the United States as a hurricane becomes minimal by the second week of October.
  • Stay away from the refiners, at least for now. I know they are cheap, but the low crack spread does not fundamentally support a rally in the sector.
  • Look for natural gas to pullback from its current price ($4.80/MMBTU) as it is up roughly 100% from its lows just three weeks ago. However, Based on my post yesterday discussing the upcoming winter, I believe the combination of a colder-than-average winter and rig count cuts may resolve our current supply glut and may put the commodity on a long term road to recovery. I continue to hold CHK, SWM, and FTK in the NG/energy sector.
  • The PPT is a tool of the gods and should be taken advantage of. It will pay for itself in the first week if properly utilized.
  • Life will get better in the Pacific Rim. They’ve had a rough couple of days–Typhoon Ketsana delivers epic flooding in the Philippines and Vietnam killing over 200 people,  a tsunami in American Saoma washes a mile inland, killing untold hundreds leveling entire villages, and now Indonesia suffers a 7.0 earthquake potentially killing thousands. Those of us bemoaning the lack of Atlantic hurricanes should be counting our blessings.

Long Term Thoughts

I have stated several times that I would do a global warming post at some point during my time as a tabbed blogger. Because, you know, I’d hate to finish up on a positive note or anything…

Quickly, I believe in the phenomenon of climate change and I believe that it is caused by anthropogenic influences. You will find very few climate scientists out there today who refute the existence of global warming. Rather, the occasionally heated debate revolves around the severity and timescale of the warming. These are now the people who are commonly referred to as “Skeptics.” I have had the opportunity to work with such a scientist and I believe I greatly benefited from seeing both sides of the coin.

Anyways, instead of pulling out an epic Here’s-Why-Your-Great-Grandchildren-Will-Drown sort of post, I am going to focus on one particular aspect of climate change that I believe the be of greatest concern in our lifetimes: The melting of the Polar Ice Caps.

First, to refute one commonly held belief: the melting of the polar ice sheets will NOT directly contribute to sea level rise. Because they are floating on top of the Arctic Ocean and displacing their weight in water, their complete melting theoretically should contribute zilch to sea level rise.

What is of concern, however, is that the melting of the polar ice caps is part of a proposed positive feedback cycle (aka a Vicious Cycle) that has the potential to accelerate the rate of warming much faster than has been projected by many climate models. Here is how it works.

  1. Humans burn carbon-based fuel which generates carbon dioxide.
  2. The carbon dioxide behaves as a greenhouse gas raising the temperatures a small amount.
  3. The marginally elevated temperature slightly accelerates the melting of the Polar Ice Caps exposing more of the Arctic Ocean during the summer melt season. This is the stage we are right now.
  4. The Heat Capacity of water is greater than that of ice, meaning that is better at absorbing incoming radiation (i.e. heat) rather than reflecting it back into space. This introduces the idea of an Albedo, or the extent to which an object reflects rather than absorbs light, expressed as a ratio. Sea Water has an albedo of near .90 while sea ice has an albedo of around 0.70, meaning sea water absorbs more heat than ice.
  5. Newly exposed ocean absorbs more heat than the ice that used to cover it, compounding the warming from greenhouse gasses
  6. This leads to further ice-cap melting, exacerbating the compounded warming, which melts more ice, and so on and so forth…a vicious cycle that feeds on itself.

This is illustrated in graphic form below in Figure 1 for the visual readers.

viciouscycle

Figure 1: Proposed positive feedback loop due to the melting of the polar ice caps

Polar Sea Ice is generally very thin (less than 75 feet thick) compared to continental glaciers (over a mile thick) and thus  it forms a very cyclical pattern of melting during the summer and reforming during the winter. Figure 2 below shows the maximum extent of ice coverage in March following winter and in September following the summer melt season.

seaiceavg

Figure 2: Maximum ice extent in March after Northern Hemisphere winter and minimum extent in September after summer (Source: National Snow and Ice Data Center)

Basically, this transient nature of sea ice means that the polar ice cap is very vulnerable to small changes in temperature when compared to more permanent continental glacial ice. Since it responds very quickly to small changes in temperature, it is also a very sensitive measurement of global warming.

Polar ice caps have been melting consistently since the mid-1970s (and probably before that, though detailed records were not kept), with the pace accelerating over the past 10 years. 2007 saw the greatest melting on record, with the minimum ice extent in September diverging nearly 5 standard deviations from the 30-year mean, or about 60% of normal.

For the past three years including this summer, the melting has been substantial enough to open the fabled Northwest Passage around Canada and Northeast Passage around Russia for the first time since the human race has turned its eyes to the seas. One final piece of investment advice: Take a look at Canadian and Russian shipping companies. They could make a bundle off of this once the various license agreements are sorted out.

Anyways, the extent of arctic sea ice melting since the mid-1950s  is shown below in Figure 3.

seaicechange

Figure 3: Ice Cap extent, deviation from 30 year average (Source: National Snow and Ice Data Center)

You will notice that the past two years have seen a bit of a recovery. However, I just equate this to an “oversold” rally, in which some negative feedback mechanisms/flukey cold winters kick in and stop the bleeding. Figure 4 below shows the melting over just the past five years and indicates that while 2009 is comfortably above 2008 and 2007, it still remains more than 2 standard deviations below the mean.

sie909

Figure 5: Polar Ice Cap melting over the past four years, compared to a 20 year average (Source: National Snow and Ice Data Center)

I predict with near 100% confidence that we will see new arctic sea ice lows within the next five-to-ten years. There is even an outside chance that sea ice may disappear altogether during the summer months by 2030-2040.

Okay, so based on the Positive Feedback cycle I outlined above in Figure 1, the next step in the cycle is warming of the water exposed/near the melted sea ice due to its increased heat capacity. Well, Figure 6, which shows sea surface temperature anomalies for this past August, indicates that the greatest warming is localized in the extreme northern latitudes exactly as expected.

tempanomalies909

Figure 6: Sea Surface Temperature anomalies showing the greatest departure from average in the far northern latitudes. Some warming is also seen in the equatorial east Pacific, indicative of a weak El Nino (Source: NOAA)

Such extreme (>5 degree) warming in the arctic has been a common theme in the arctic for the past half decade or so. Global temperatures respond much slower and it will be several years before we begin to see the effect of melting polar ice caps on accelerating the rate of Global Warming. In the short term, however, I expect the warming of the Arctic Ocean to continue to positively feedback on the rate of sea ice melting and a gradual downtrend of summer polar ice coverage will resume.

What will be the end result should the ice caps vanish for part of the year? There are several “doomsday” scenarios that result in runaway climate change, and while I am somewhat skeptical of all of them, I see the rapid increase in warming from melting polar ice caps as a possible trigger. These scenarios include:

  • The overturning and release of carbon dioxide and methane currently sequestered in the oceans (i.e. the dire sounding “Clathrate Gun Hypothesis”)
  • The accelerated melting of the Greenland Polar Ice Sheet since the continental ice sheets are no longer held back by sea ice. Compared to the melting of polar sea ice, the collapse of the Greenland Ice sheet will raise sea level (by about 20 feet)
  • The collapse of the Thermohaline Circulation that drives heat transfer in the oceans. Interestingly, this is believed to have resulted in the Younger Dryas, a period of rapid cooling and glaciation about 12,000 years ago (The movie The Day After Tomorrow tries to show something like this)
  • The extinction of the poor polar bears.

These theories likely sprung up as the result of a bunch of climate scientists getting together late at night in tents and trying to top each-other’s scary stories, while illuminating their faces with cheap flashlights. While they may logically make sense, there is no reason to become concerned in the short term.

.

Hurricane Identification Contest Results: All Hail DPeezy

dpzavatarSo for the past three months I have been running a contest here on my tab for readers to identify hurricanes based on an unknown satellite image. I am pleased to announce that after 90 days and 42 different storms, DPeezy has emerged the winner, defeating second place finisher Wabisabi 17-12. Props for ending on a prime number.  Figure 7 below shows DPeezy’s path to victory.

finalrankings

Figure 7: Hurricane Contest Final Rankings

I was very impressed with the weather IQ of iBC readers over the course of these three months as every single storm was ID’d. I assure you, if Accuweather or another weather site had a Ticker Symbol Identification contest, there woulld likely be a lot of crickets chirping…

For his efforts, DPeezy is awarded a hurricane warning flag like those you might see at the beach telling people to get the hell out of the water, and, most likely, out of the county.

Congratulations DPeezy. I strongly advise everybody to read his work in the Peanut Gallery. His posts focus on options, a realm that is not strongly covered anywhere else on ibankcoin. Since the founding of iBC he has been one of the most consistent posters on the site and is one of few whose posts I always take the time to read. The guy has a good work ethic, knows his hurricanes, and is one of the favorites to win the 2nd annual iBC Fantasy Football League. Quality.

DPeezy, email me a shipping address to receive your flag.

In conclusion, I would like to thank everybody who has taken the time to read and comment on my blog here.  It is a rare thing to be able to write about two of the topics that one enjoys most. I would like to thank the Fly for bullying me into accepting this honor. Having followed the site since the Blogspot days, I can honestly say iBankcoin is truly the premier investment website on the web (as well as the most entertaining). Should anything of interest arise, I may post in the Peanut Gallery, either as Dr. Cane or as my old name, Veritas5. I will continue to hang out on Twitter as DrCane09 as well.

Congratulations to Henry Fool on his tab. I’m looking forward to the picks.

Peace.

Dr. ‘Cane

Comments »

Winter 2009-2010 Outlook: Chalk One Up for the Farmer’s Almanac

hurricanefinalObviously, today’s storm is not a hurricane, but it relates well with the theme of the post. This will be the final storm in the contest. “Awards Ceremony” tomorrow…

As we move into the fourth quarter, I thought it would be appropriate for my penultimate post to discuss what we might expect from Mother Nature over the next 4-6 months, and its possible repercussions for the stock market.

Before discussing the meteorological driving forces behind the upcoming winter, let’s start with a look at one of the oldest “forecasting” tools out there: The Old Farmer’s Almanac. First published in 1818, the Almanac uses the voodoo-pseudo-science of sunspot activity, tides, and planetary position to predict the upcoming winter, which is spelled out by their chief “meteorologist”, an entity known only as Caleb Weatherbee, who has apparently been around since the publication’s founding.

Now, I don’t mean to bash the Almanac, and will admit to buying and perusing a copy upon its release each year, but their claim of an 85% accuracy rate is questionable at best. Even modern meteorology, supported by supercomputers, satellites, and PhDs from MIT, can’t boast that level of forecasting. Besides, what defines an “inaccurate” forecast from an “accurate forecast”: having it be sunny when the forecast said precipitation, having it rain when the forecast said snow, receiving eight inches of snow when the forecast said seven, etc?

Anyways, I don’t usually put too much faith in the Farmer’s Alamanac and usually read it primarily for its entertainment value. Nevertheless, Figure 1 below shows their forecast for the upcoming winter season.

ofa0910

Figure 1: Winter 2009-2010 Forecast Issued by the Farmer’s Almanac

The primary observation one draws from this forecast is that it is going to be cold just about everywhere (except the Southeast and Southwest). Additionally, the East Coast can expect to see snowier-than-average conditions while the Midwest and West can expect drier-than-average conditions.

With these initial observations in mind, let’s consider the non-tea-leaf-based meteorology.

There are two driving forces for the upcoming winter, and I will briefly discuss each one in turn.

Persistence

Unless you have been living in the Pacific Northwest, Summer 2009 has generally been exceptionally cool, particularly across the Midwest, Mid-Atlantic, and Northeast.

The cool weather pattern arose due to an unusually amplified (i.e. wavy) jet-stream with a large ridge of high pressure in the West (hence their above average weather) and a complementary trough in the East, which brought a cool Canadian airmass southward and was accompanied by an active storm track. This situation is shown below in Figure 3.

summerstart

Figure 2: Primary weather pattern in the Summer of 2009 featuring warmth in the West, cool weather in the Midwest and Northeast, and an active storm track.

Climatologically, patterns tend to persist and a cool summer has historically resulted in a cool winter. Thus, based on persistence, one might expect cool weather east of the Rockies and warmer weather in the West. Additionally, a large ridge is characteristic of High Pressure, meaning drier conditions in the west as well. Likewise, a trough off the east coast results in a storm track that zips nor’easter-type storms up the East Coast, as has been seen several times this summer, most recently this past weekend.

El Nino

El Nino will probably not be as big a factor in the upcoming winter as some were anticipating a few months ago. The El Nino of 2009 has weakened since peaking as a moderate event in July and is dwarfed by the great El Nino of 1997-98, and is now similar to the weak El Ninos we saw in the winters of 2002-2003, 2004-2005, and 2006-2007. A map of traditional El Nino effects is shown below in Figure 3.

elninoeffects

Figure 3: Typical conditions during an El Nino year, featuring cool and wet conditions across the South and warm and dry conditions across the Midwest and Great Plains.

Historically, El Nino has resulted in warmer than average conditions across the northern half of the country (with the exception of the extreme Northeast) and cooler-than-average conditions across the southern half. This is due to the Polar Jet Stream being displaced to the north, with a much larger-than-average ridge building in the west and Midwest and a weaker-than-average trough across the East. This results in both warmer and drier than average conditions across these regions.

The south is generally wetter than normal due to a very fast west-to-east Subtropical Jetstream that cuts from Baja California across the Southeast. The frequent rainfall and cloudiness associated with the Jetstream helps to keep these areas below average. Due to the rather flat, un-amplified Jetstream, the Northeast and Mid-Atlantic does not see the powerful nor’easters that it can see with a highly active jet.

Dr. Cane’s Forecast: Party Like Its 2002-2003

Considering both a weak El Nino and the persistent weather pattern in the United States, my predictions for the winter of 2009-2010 are highlighted below in Figure 4.

winter2

Figure 4: My predictions for the upcoming winter taking into account our persistent weather pattern and a weak El Nino

  • I expect a potentially cold and snowy winter across the Northeast and Mid-Atlantic due to a persistent trough pumping in cold air and carrying storms through the region.
  • I expect wetter than normal conditions across much of the South due to a strong subtropical Jetstream associated with a weak El Nino
  • I expect dry and generally tranquil conditions across the upper Mid-west and Plains as a ridge of high pressure dominates this region.
  • Elsewhere, I see equal chances of it being warm/cool and dry/wet.

Based on these forecasts, I expect a winter somewhat similar to that of 2002-2003, another weak El Nino event that featured a persistent trough in the East, bringing some big-time snow on the East Coast. The President’s Day Storm of February 14-16, 2003 covered all of the major cities with at least 15-30 inches of snow, with parts of Baltimore picking up 3 feet! The snow was piled so deep across such a wide area that the snowcover was clearly visible from space, as shown below.

pdaystorm

Figure 5: Snowcover in the in the East following the President’s Day Storm of 2003. All of the white in the Midwest and East are not clouds but rather very deep snow on the ground that can be seen from space.

The winter ranks among the top 10 snowiest for many areas east of the Mississippi River. Additionally, bitterly cold air frequently dove down from Canada inundating the Midwest and Northeast with below zero temperatures.

In conclusion, let’s look back at the projections made by the Farmer’s Almanac in Figure 1. Whadya know, they actually look pretty good! They too project a wet and snowy time of it across the Northeast and Southeast with dry conditions in the Midwest. I believe they  are overdoing the extent of the cold air in the upper mid-west, since weak El Nino conditions tend to moderate air-masses in this part of the nation. That being said, I find myself in surprising agreement with much of their forecast.

Perhaps Mercury being in retrograde can tell me if it will rain tomorrow after all…

.

Winter and the Markets: Shades of 2002-2003

While cool, moderate weather was terrible for the futures markets during the summer, cold, bitter weather jacks up heating demand during the winter and can result in price spikes in the energy markets. As I expect the coolest weather to occur across the densely populated East Coast and Midwest, this could be precisely what the natural gas market needs to reverse its current supply glut.

As El Nino will likely play a role in the upcoming winter season, it may be beneficial to look back at weak El Nino events from recent years for some comparison. Fortunately, we have had three this decade alone–in 2002-2003, in 2004-2005, and in 2006-2007. Figure 6 below shows natural gas withdrawals during these years compared to the five-year average during that time.

elninong1

Figure 6: Natural Gas Withdrawals during the winter in weak El Nino years. Note that 2004 and 2006 are near to just below average while 2002 is substantially below average.

Natural Gas withdrawals during these years were near-to-below average, or in the case of 2002-2003, a particularly snowy winter across the Northeast as already noted, significantly below average. Based on my “cold and snowy forecast” I am anticipating a withdrawal season somewhat similar to that of 2002-2003, which bottomed at roughly 600 bcf BELOW the seasonal average. Given that we are currently 525 bcf ABOVE the seasonal average, such a winter would just about sort out the NG market’s supply problems. How nice and tidy.

Not only is the prospective meteorological environment in 2009-2010 similar to 2002-2003, but I see a correlation between the state of the two natural gas marekts as well.

Due to increased production and a declining economy, natural gas prices fell from $7.00/MMBTU to as low as $2.00/MMBTU early in 2002, leading to a drastic 50% cut in the rig count by the summer of 2002, similar to what we have seen in 2009.  A comparison of the rig count cuts is shown below in Figure 7. Notice the close correlation between the two periods.

rigcounts0108

Figure 7: Changes in rig counts leading up to the cold winter of 2002 compared to our current period

The cold and snowy winter that followed in 2002-2003 led to rapid withdrawals and saw the commodity rally by nearly 250% to $9.00 by the end of the 2003 withdrawal season! Granted, this was before the rise of horizontal drilling and other highly efficient recovery techniques that we now have, but it gives a potential blue print to the effect of both a cold winter and falling rig counts.

Conclusion: Weak El Nino + Persistent East Coast Trough + Rig Cuts = Winter 2002-2003=NG Price Spike?

Based on this rather crude forecasting and estimating, I continue to maintain my natural gas exposure in the form of Chesapeake ($22), Southwestern Energy (SWN) and Flotek ($2.00), and may consider adding to my FTK position..

In terms of opportunities outside of the energy sphere, I may look at the following sectors.

1)      Utility Companies-benefit from high electricity demand during cold and stormy weather.

2)      Home Improvement-Companies like Lowes and Home Depot do a brisk business leading up to winter storms and, in the case of damaging ice storms, the recovery afterwards

3)      Rock Salt (Calcium Chloride) manufacturers? I’ve always wondered about this one since there is enormous volatility in consumption depending on the weather, but haven’t found any publicly traded companies specializing in the product.

As my term ends tomorrow 9/30, I will have a final concluding post with some last thoughts….

Note I: Dr. Cane is now on Twitter as DrCane09 since this is often a faster way to provide updates as things quickly change. FOLLOW ME for regular updates regarding the Tropics, Trading, and misc other weather stuff.

Note II: The Hurricane Naming Contest is on the homestretch with the season finale coinciding with the end of the MLB season September 30. Current leaders are shown below.

Obviously, today’s storm is not a hurricane, but it relates well to the theme of this post…

Rankings 9/29/09

Points

Points Back Days to Elimination

1. DPeezy

16

2. Wabisabi

12

4.0

Playing For Pride

3. TraderCaddy

4

12.0

Playing For Pride

4. Yogi & Boo Boo

3

13.0

Playing For Pride

4. BuffaloUdders

3

13.0

Playing For Pride

4.  Jimmy Hill

7. Jim

3

1

13.0

15.0

Playing For Pride

Playing For Pride

Comments »

The Meteorological Week Ahead: The Hammer Drops

thefinalhurricane38

It’s time for summer to meet it maker. While there have been isolated hints of autumn across the United States since early September, the hammer will finally drop this week, ushering in Fall across the entire country. The resultant marked increase in Heating Degree Days will likely mark the beginning of the Natural Gas Heating Season, with net injections dropping off precipitously in the coming weeks.

Nearly the entire nation will be cooler than last week and generally below average for this time of year. A strong Cold Front will pass through Chicago and the upper Midwest tonight, and off the Eastern Seaboard by Monday night. The decidedly Canadian airmass flowing in behind the front will bring brisk northwest winds and a crisp bite to the air. Daily temperatures east of the Rockies in the Midwest, Northeast, and Mid-Atlantic will average 10-15 degrees below average with highs in the 50s and low 60s and lows in the 30s and 40s.

The West Coast will see below average temperatures as well as a trough of low pressure and an offshore area of high pressure will bring much cooler weather to areas of the Valley of California that were near 100 last week. Total Cooling Degree Days are shown below in Figure 1 for this week.

Figure 1: Forecast Total Cooling Degree Days for Sept. 27-Oct. 2

cddsept3png

CDDs are restricted to the Gulf Coast states and the warmer parts of the Desert Southwest. With the exception of some warmth in Texas, this pattern resembles the winter range of CDDs. From now on, cooling demand will contribute only minimally to total energy demand.

Total Heating Degree Days are shown below in Figure 2.

Figure 2: Forecast Total Heating Degree Days for Sept. 27-Oct 2

hdd3

Heating degree days will surge this week, with noted increases in the northern Great Plains states of Montana, North and South Dakota, Minnesota, and Wisconsin. The population density of these states is generally small and thus will only modestly affect the total heating demand. However, similar heating demand will be seen across the more densely populated Mid-Atlantic and Northeast. While the major cities will generally see less than 50 HDDs for this upcoming 6-day week, the secondary cities of the interior, including Pittsburgh, Syracuse, Albany, Hartford, and Bangor will approach 100 HDDs.

Numerically, the nation can expect to see 4159 total population-weighted Degree Days (HDDs + CDDs), or 6.1% fewer than last week due to the rapidly retreating warmth. However, while Heating Degree Days made up just 7.1% of total degree days last week, they will make up 58.7% this week! This represents a 678% week-over-week increase in Heating Degree days. This data is shown below in Table 1.

Table 1: Numerical Degree day Data

Last Week This Week % change
CDDs 4115 1714 -58.3%
HDDs 314 2445 +678.7%
Total 4429 4159 -6.1%

Despite the net 6.1% decrease in degree days, the marked increase in HDDs will result in increased NG consumption as a heating degree day carries a slightly higher energy demand than a cooling degree day. I project that we will see a 56 BCF injection for the EIA storage report to be released October 9. This compares to a five year-average of +64 BCF. Historically, the first net withdrawal occurs the second week in November. I believe that we will see our first withdrawal at least a week early this year, due to the prospect of cooler temperatures and cuts in production and drilling.

In conclusion, Fall is here, and here to stay. Based on this week, it seems we will have a rather cool going of it, although not as rough as these guys are predicting…

watch?v=siM6CPniUgU&feature=related

The Tropics

The National Weather Service classified an area of low pressure off the coast of Africa as Tropical Depression #8 Friday afternoon. Advisories were discontinued 24 hours later as the system was torn apart by shear. Personally, I didn’t really agree with the classification and don’t believe it ever reached TD status. Regardless, former TD-8 has continued to weaken and will not threaten any landmass.

Elsewhere in the tropics, it’s the same old story: high wind shear. There are no areas of concern in the Atlantic and I give only a 30% chance of seeing a named system this week. One of the models is forecasting development off of Africa by next weekend, but this late in the season such a storm would not likely affect land.

We are rapidly winding down the hurricane season, especially for the United States, as seen below in Figure 3.

hurricanefreq927
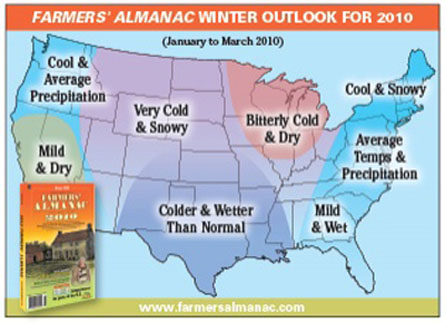
Figure 3: Hurricane Frequency

You will notice that there is a small secondary peak in mid-October. This is due to an increase in cyclones forming in the western Caribbean. These storms do not usually affect the United States due to the climatologically unfavorable conditions in the northern Gulf of Mexico by that time. However, south Florida is still affected on occasion (i.e. Hurricane Wilma, 2005).

On a more unfortunate note, tropical storm Ketsana crawled through the Philippines as a modest tropical storm, bringing historic rainfall to the capital city of Manila. The airport received 16.7 inches of rain in just 12 hours, an all-time record. Thus far, Ketsana is responsible for at least 105 deaths and has left 250,000 people homeless. This toll will likely climb higher. Ketsana has continued to strengthen and will likely hit Vietnam as a minimal typhoon on Tuesday. The latest satellite image of Ketsana is shown below in Figure 4.

ketsanaFigure 4: Tropial Storm Ketsana in the South China Sea

My term as a tagged blogger on iBC concludes this Wednesday, 9/30. I will have a post Monday or Tuesday giving my winter 2009-2010 outlook and its implications for the energy markets. I will have a concluding, but content-heavy post on Wednesday.

Note I: Dr. Cane is now on Twitter as DrCane09 since this is often a faster way to provide updates as things quickly change. FOLLOW ME for regular updates regarding the Tropics, Trading, and misc other weather stuff.

Note II: The Hurricane Naming Contest is on the homestretch with the season finale coinciding with the end of the MLB season September 30. Current leaders are shown below.

DPeezy clinches, but JimmyHill is on a roll…

Rankings 9/20/09

Points

Points Back Days to Elimination

1. DPeezy

16

2. Wabisabi

11

5.0

Playing For Pride

3. TraderCaddy

4

12.0

Playing For Pride

4. Yogi & Boo Boo

3

13.0

Playing For Pride

4. BuffaloUdders

3

13.0

Playing For Pride

4.  Jimmy Hill

7. Jim

3

1

13.0

15.0

Playing For Pride

Playing For Pride

Comments »

Dousing the Refiner’s Fire

hurricane37

During the epic rally that has defined Spring and Summer 2009, one of the few sectors that did not bank coin was that of the refiners. In fact, Valero (VLO), Western Refining (WNR), and Tesoro (TSO) all made 2009 lows in July and then again in September. All three have traded down between 50-70% of their 2008 highs. However, just as the broad market has begun to trend sideways, the refiners have caught fire, trading up 20% in about 2 weeks. The question is whether this is a mere over-sold rally, or the beginnings of a real industry recovery. Based on today’s EIA supply report and continued weakness in demand, the former appears more likely, at least through 2009. This post briefly analyzes the supply-demand picture as it relates to the refiners.

Taking a step back, why did the Refiner’s get their clocks cleaned to begin with? After all, oil made its bottom in December and has doubled since then, with oil, coal and other energy stocks doubling or tripling in the same period.

Well, the rise in Crude is actually part of the problem. The refining industry is pretty clear cut, in terms of input (costs) and output ($). A refiner inputs crude oil into a cracking column, distills the nightmarish mess of various hydrocarbons, and collects the useable fractions as output, namely heating oil and gasoline.

Thus, a rally in the price of crude oil would actually hurt a refiner’s profitability, assuming there was not a commensurate rally in the price of gasoline, which there hasn’t been. This summer market rally was built substantially on speculation that the recession would improve/end, not that this recovery has been occurring simultaneously. While the price of crude oil is not really a consumable and is thus more vulnerable to speculation, gasoline is a consumer good and price is determined largely by customer demand. That demand has not materialized to match the rally in crude.

Thus, the Crack Spread, which is a measure of refiner profitability calculated as the difference between input (crude) and output (gasoline) has fallen since the beginning of the year and is now steady under $10. The crack spread is shown below in Figure 1.

crackspread92409Figure 1: Gas-Oil Crack Spread

A Crack Spread below $10 is not going to fuel any sort of sustained rally in the refiners. Rally attempts in April, May, and July were all snuffed out by heavy selling as refiners lowered earnings estimates. The most recent rally the first two weeks of September has been the strongest in 2009, on the highest volume. Let’s look at the factors of supply and demand of gasoline to see if we should anticipate more followthrough, or simply another sell-off.

First, supplies of the input, crude oil, have been consistently above average for most of 2009. This is shown below in Figure 2.

crudestocks92409Figure 2: Crude Oil Supplies

Due to the excess crude oil, gasoline supplies have also, unsurprisingly been above average their six-year averages for most of 2009. This can be seen below in Figure 3. Note the divergence between the six-year average and 2009 supplies over the past month.

gasstocks92409Figure 3: Gasoline Stocks and differential between 2009 and average

High gasoline supplies indicate both low demand and high upstream crude oil supplies. The bottom portion of Figure 3 above shows the differential between average gasoline supplies and 2009 gasoline supplies. The spike in late August was likely partially responsible for the early September refiner swoon.

Refinery Operable Capacity (ROC) is a somewhat indirect way of estimating gasoline demand, from the producer’s view. The ROC is simply the percent of maximum capacity the sum total of US refiner’s is currently operating. A high Operable Capacity indicates that the industry believes the demand for product will grow, while a low Operable Capacity indicates that demand should remain low (or a hurricane has taken capacity offline…obviously not the case in 2009. Frickin El Nino.) and it would be wise to not flood the market with excess product.

Figure 4 below shows a graph of Refinery Operable Capacity for 2009.

refinery92409Figure 4: Refiner Capacity and Differential between 2009 and average

ROC made a seasonal low in early April, as to be expected, as refiners traditionally increase output in preparation for the summer driving season. Output atypically fell from about 88% to 84% in July and early August, which was accompanied by a swandive in refiner equity prices. The most recent uptick in ROC in September is responsible for the increase in gasoline stocks mentioned above. Based on the surge in gasoline supplies seen in Figure 3, the demand was not there to accept the increased output associated with increased ROC.

Today’s EIA Crude Oil supply report indicated that Crude Oil supplies rose 2.8 million barrels, compared to a decline of 1.6 million barrels that is average for this time of year. ROC capacity declined to 85.6%, or nearly the seasonal average, for the first time this year (the rapid decline in the 6-year average is due to the prevalence of hurricanes, particularly in 2005 and 2008, during this period. The drop in ROC this week has nothing to do with hurricanes.)

Despite the dropoff, Gasoline supplies still increased by 5.4 million barrels, much higher than analyst estimates and much above the average 1.3 million barrel decline, further indicating that we are still in a high supply-low demand situation in the distillate market.

Following the storage report, TSO, WNR, and VLO declined between 2-5%.

Thus, despite the relative “cheapness” of some refiners, I would advise sitting on the sidelines right now. That being said, I believe there is limited downside to these stocks and would not advise taking short positions, or perhaps not even selling if you currently own them. The fundamentals just do not support a continued rally. I would not be surprised a significant pullback followed by some sideways action as a bottom tries to form.

Based on this rambling summary, here is what I want to look for before diving back into refiners.

High gasoline stocks mean either demand is low or crude oil supply is high. Likewise, high ROC means that refiners either anticipate a return of demand in the near-term, or are simply increasing capacity to cope with all the crude oil out there. I believe that all four of these conditions are influencing the current supply picture.

The only way to determine if demand is really increasing is to see both ROC increase/decline less than the seasonal average AND see gasoline supplies decline faster than the seasonal average. This indicates that despite increased output from refineries and more gasoline on the market, demand really is increasing. Obviously, this is not currently the situation.

As for individual stocks, WNR, VLO, and TSO are the best out there. I was in WNR from about 5.80 and got stopped out this morning at 7.70 for a nice 30% gain. Should the supply-demand picture show signs of turning around, I will look to get back in when the market pulls back. One-year charts of all three are shown below.

vlo92509

wnr92509

tso92509

Of my other energy positions, I am up about 40% on my CHK position and 20% on my SWN position, and may look to sell portions on strength to lock in some profits. I’m trusting the Fly on my small FTK position and will wait till $3.00.

The tropics remain quiet and it is unlikely that anything will develop this week. TS Nora has formed in the very active Eastern Pacific, which, if it picks up the pace, has an outside chance of completing the alphabet this season. As inactive as the Atlantic has been in 2009, the E. Pacific has been as active. This is typical of El Nino.

Note:I will continue posting up to the end of my term next Wednesday, 9/30.

Note I: With the hurricane season heating up, Dr. Cane is now on Twitter as DrCane09 since this is often a faster way to provide updates as things quickly change. FOLLOW ME for regular updates regarding the Tropics, Trading, and misc other weather stuff.

Note II: The Hurricane Naming Contest is on the homestretch with the season finale coinciding with the end of the MLB season September 30. Current leaders are shown below.

Today’s storm is a hat-tip to TraderCaddy who was commenting on the lack of S. Florida storms this year…

Rankings 9/20/09

Points

Points Back Days to Elimination

1. DPeezy

16

2. Wabisabi

11

5.0

2

3. TraderCaddy

4

12.0

Playing For Pride

4. Yogi & Boo Boo

3

13.0

Playing For Pride

4. BuffaloUdders

3

13.0

Playing For Pride

6.  Jimmy Hill

7. Jim

2

1

14.0

15.0

Playing For Pride

Playing For Pride


Comments »

The Meteorological Week Ahead: Indian Summer

hurricane36

Well, the Autumnal Equinox is this Tuesday and the world will officially welcome in Fall. For those wondering, the equinox is that day when the Sun is directly above the equator. The term comes from the latin Aequus (equal) and nox (night), since it had been believed that on this date day and night are of equal lengths (12 hours) at any point in the world. However, this is not exactly true. Rather, the equinox is the day when any two locations at the same distance north and south of the Equator (i.e. 30 N and 30 S) will experience days and nights of equal length.

Moving on, expect a general warm-up this week across the eastern half of the country and a cool-down across the west. The eastern half of the country will see a period of Indian Summer, or a brief return to summer-like conditions before the hammer of Fall slams down.  After a very cool start this morning, most of the major cities will see highs in the mid 70s for the first half of the week, warming into the low 80s for the end of the week.  These temps will be roughly 5-10 degrees above average. The west, as has been true for most of the summer, will be very warm for this time of year due to a persistent offshore flow. Seattle and Portland will reach the mid 80s and mid 90s, respectively. Even perpetually-foggy San Francisco will see temperatures fly into the low 90s Monday and Tuesday, about 20 degrees above average.

On the other hand, the Colorado Rockies will see very cool weather, with measurable snow on the higher peaks and temperatures not climbing out of the 30s and 40s. Areas of the western Dakotas that saw highs in the 90s last week, will cool back towards average with highs in the 60s.

Both projected Cooling Degree Days and Heating Degree Days will climb this week, CDDs due to the warm-up in the West and East and HDDs due to the cool temperatures in the Rockies. CDDs remain the dominant form of population-weighted energy demand, representing 90% of the total degree day total. Figures 1 and 2 below show projected CDDs and HDDs for the upcoming week, respectively.

Figure 1: Projected Cooling Degree Days

cddsept2png

.

Figure 2: Projected Heating Degree Days

hdd2

Total population-weighted degree days will climb by 731 to 4419 this week, and increase of 19.8% from last week. Breaking this down, Cooling Degree Days will climb by 16.9% to 4115 while Heating Degree days will climb by 75.9% to 314 from the week-ago period. Heating Degree Days will climb from representing 4.8% of the total Degree Days last week to 7.6% of the total this week, indicating that Fall is indeed on the way. Numerical HDD and CDD is shown below in Table 1.

Table 1: Degree Day Data

Last Week This Week 1 week Percent Change
CDDs 3519 4115 +16.9%
HDDs 179 314 +75.9%
Total 3698 4429 +19.8%

.

I project that the forecasted degree days will yield an injection of +65 BCF in the EIA storage report to be released October 1 for this week. This would be below the average of +70 BCF for this week, and below last year’s injection of +87 BCF. On average, there are six more weeks remaining in the NG injection season. Once the rollover from Oct ’09 to Nov ’09 contracts occurs this week, NG will be above $4.50/MMBTU, an 80% rally/Contango-driven madness  from its 7-year lows just 3 weeks ago. I think a pullback is in order.

The Tropics

The tropics remain quiet. For yet another week. A large area of disturbed weather named Invest 98l by the NHC is developed by multiple models, but would likely recurve out to sea if it did organize. Right now, it appears very disorganized and is heading towards a region of increased shear. I give it a 30% chance of ever becoming Grace.

The remains of Hurricane Fred continue to move WNW across the open Atlantic but are no threat to re-develop. However, the moisture will move into Florida and South Carolina by mid-week bringing the chance of heavy rain.  A map of the tropical Atlantic is shown below in Figure 3.

atlantic92009Figure 3: Current satellite of the Tropical Atlantic showing generally quiet conditions.

Elsewhere, there really is nothing of concern and none of the models indicate development over the next week. Wind shear will remain high across much of the Atlantic helping to preclude development. This has just not been the season for hurricanes…

Note I: With the hurricane season heating up, Dr. Cane is now on Twitter as DrCane09 since this is often a faster way to provide updates as things quickly change. FOLLOW ME for regular updates regarding the Tropics, Trading, and misc other weather stuff.

Note II: The Hurricane Naming Contest is on the homestretch with the season finale coinciding with the end of the MLB season September 30. Current leaders are shown below.  Everybody needs to put on their rally caps and get into gear…

Rankings 9/20/09

Points

Points Back Days to Elimination

1. DPeezy

16

2. Wabisabi

11

5.0

6

3. TraderCaddy

4

12.0

Playing For Pride

4. Yogi & Boo Boo

3

13.0

Playing For Pride

4. BuffaloUdders

3

13.0

Playing For Pride

6. Jim + Jimmy Hill

1

15.0

Playing For Pride

Comments »

Natural Gas Contango Breaking Down

hurricane35

The super contango that has plagued the natural gas market during most of its decline this past spring and summer is showing signs of falling apart with this most recent rally. For those unfamiliar with the futures market, natural gas is traded in “contracts,” which is the obligation to purchase a certain quantity of a commodity at a specific date. Contract expirations are in months. So, for example, holders of a “November ’09” contract are obligated to take delivery at the expiration of that contract, usually in the final week of the month. The Front Month contract is the next futures contract to expire and is usually the most actively traded. The price of the Front Month contract is closely related to the Spot Price, or the price that is most frequently quoted on CNBC or Yahoo Finance or wherever.

Contango is the situation that arises when each successive month’s contract is progressively more expensive than the Front Month Contract. This has been the situation in the natural gas space most of the summer. At the beginning of September, for example, the Front Month Oct ’09s were trading near $3.00/MMBTU while the Nov ’09 contract was near $4.00 and the Dec ’09 contract near $5.00.  This marked the most extreme contango I’ve seen in the market, with the contract 2 months out trading at a 60% premium to the front month.

Throughout the summer, each time the front month contract expired, the quoted spot price would spike perhaps 10% due to rollover and Contango. This was met with immediate selling on concerns of both supply and demand, sending both the spot price right back down, and dragging the forward month contracts down with it. This has put a dent in many an attempted rally. I have been saying all summer that I didn’t believe NG could rally until the Contango broke down.

Well, my friends, that date may have finally arrived. Over the past two days, the front month has rallied substantially compared to the November and December contracts. The price gap between Oct ’09 and Nov ’09 has fallen from nearly 35% gap to 25%. Today’s trading illustrates this breakdown:

Table 1: NG Session Overview (1:30 pm, 9/15)

Contract Last Price Today’s Change Today’s % Change
Oct 2009 3.55 +0.25 +7.5%
Nov 2009 4.44 +0.11 +2.5%
Dec 2009 5.04 +0.05 +1.00%
Jan 2009 5.30 +0.03 +0.57%
Feb 2009 5.34 +0.02 +0.03%

.

Obviously, a substantial contango still exists, but I believe that this is the beginning of a move towards a more stable futures market. Looking back, the collapse of Backwardation (the opposite of Contango, i.e. the forward months are less expensive than the front month) marked the beginning of the breakdown in oil last summer. Once oil fell all the way to $30/Barrel, the Backwardation had turned into Contango. The collapse of this new Contango marked the beginning of the oil rally late last winter. Basically, the breakdown of extreme Contango/Backwardation conditions has historically resulted in a long-term price reversal. Obviously, there are many more forces at work that simply Contango, but I appreciate it as a broad indicator of the market.

I believe that this situation bodes well for natural gas heading into what promises to be a cold winter. I believe NG may pull back quite a bit in the next few weeks, especially as we approach peak storage, but am confident we have now reached the bottom. I do, however, expect the Contango to continue to narrow.

In terms of investing, I have no desire to directly buy UNG, as that fund is completely broken. GAZ, a similiar fund, is marginally more attractive, but would still advise staying away.

The Fly’s calls with FTK, HERO, and GMXR looks to be right on. I own a small quantity of FTK from about $1.90.

My big positions in energy have been Chesapeake (CHK) and Southwestern (SWN). I own CHK from $21.50 and am enjoying a 30% gain in the position since early July.

I plan to hold all three of these positions. For those looking to get into the market, I would consider waiting for a pullback.

The Tropics

Still all quiet on the Eastern/Southern Front here. The remnants of Hurricane Fred are still hanging together and there is a small chance it could regenerate once it encounters more favorable conditions in a day or two. Several models have been consistently forecasting development of a wave between Africa and the Leeward Islands by the weekend. It is too early to tell if said wave will recurve or enter the Caribbean.

Note I: With the hurricane season heating up, Dr. Cane is now on Twitter as DrCane09 since this is often a faster way to provide updates as things quickly change. FOLLOW ME for regular updates regarding the Tropics, Trading, and misc other weather stuff.

Note II: The Hurricane Naming Contest is on the homestretch with the season finale coinciding with the end of the MLB season September 30. Current leaders are shown below.  Everybody needs to put on their rally caps and get into gear…

Rankings 9/15/09

Points

Points Back Days to Elimination

1. DPeezy

16

2. Wabisabi

11

5.0

10

3. TraderCaddy

4

12.0

3

4. Yogi & Boo Boo

3

13.0

2

4. BuffaloUdders

3

13.0

2

6. Jim

1

15.0

Playing For Pride

Comments »