iBankCoin
Full-time stock trader. Follow me here and on 12631
Joined Apr 1, 2010
8,861 Blog Posts

Stock #Market Recap 10/29/14 {Video}

If you enjoy my blog posts and videos, then I would encourage you to please click on this 12631 hyperlink for more details about joining our great team of traders at a very reasonable price. 12631 is a trading service which @RaginCajun and I direct here at iBankCoin.

In addition, please see the top of this video for details about attending our iBC Investors Conference this November.

Enjoy tonight’s video, and enjoy your evening. 

Direct Vimeo Link Click Here

Comments »

The Chunnel Tunnel in Effect

the-channel-tunnel-traveling-under-the-sea-18461_4

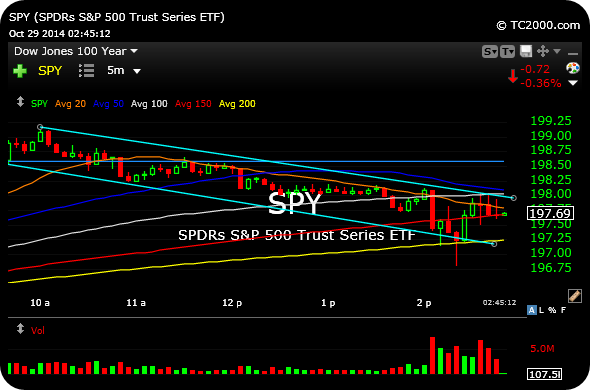
The SPY intraday chart, below, shows a falling channel since the open this morning.

Even with the FOMC announcement of the end of QE, the chart has not yet broken one way or the other.

In determining whether to swing some index longs or shorts, this chart is going to be one of my key reference points.

___________________________________________________________

SPY

Comments »

The Only Way Out of a Market Held Hostage by QE

I’m still flat ahead of the Fed. Let’s see what maniacal policies they have up their sleeves, next.

After the reaction to the Fed, I am looking to get involved.

If the market sells, some short ideas: HD LOW SBUX UA UNP

if we rally: TUBE, precious metals and miners, natural gas.

Comments »

These Five Stocks Are for Fighting AND for Fun

ThisisMyRifle

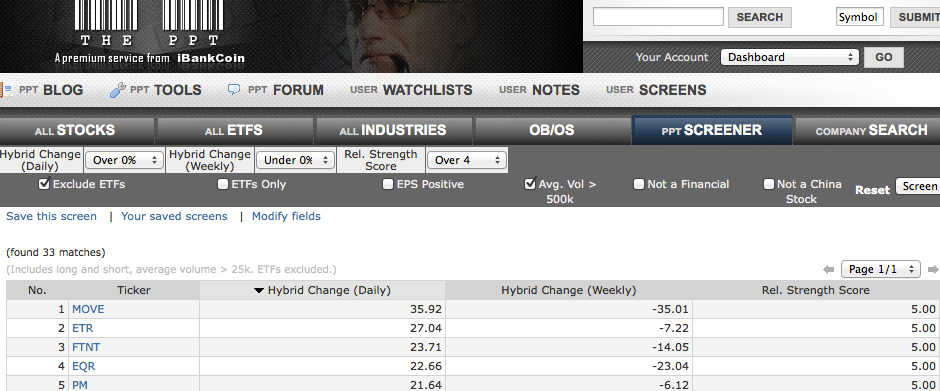
Courtesy of The PPT algorithm, here are the most current top five readings from my “12631 RELATIVE STRENGTH” custom-made screen, identifying which stocks are exuding some of the best performances to the market at-large at any given moment.

I look for stocks whose Daily PPT Hybrid Score surges, while the Weekly Hybrid has been negative over the past week. This can often yield stocks which are emerging from consolidations.

Members can click here to view and save the screen.

Sorted for at least 500,000 shares of daily average volume to ensure liquidity.

Please click on image to enlarge.

________________________________________________________________

2014-10-29_1233

Comments »

A Quick Trip Underwater

aPVVbQs

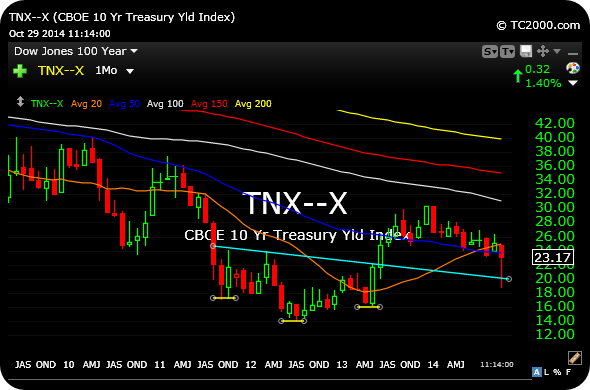
That spike higher in bonds, and thus spike lower in rates on the 10-year, temporary took yields below their primary breakout level from the confirmed inverse head and shoulders bottom from 2011-2013.

Below, on the monthly chart for the TNX, or 10-Year Treasury Yield Index, you can see as much.

But yields did not stay down there for very long, and the bottoming formation is still intact.

Headed into the Fed today, I am still looking to see if the bond market decides to rebel against the Fed and express a loss of confidence in their policies. In my view, the bond market is likely the only entity who can, in theory, prevent the Fed from doing whatever they please.

_______________________________________________________

TNX

Comments »

Prepping for the Big Screen

X0KVMqh

Small caps are circling back to the flatline off after moving higher from the open, as I expect the market to essentially drift into the big FOMC announcement later today, after 2pm EST.

Natural gas is off to a decent start and still has my interest on the long side.

And I would resist going long Facebook at least until it fills the $73.35 gap below, highlighted on the daily chart.

__________________________________________________

FB

Comments »