From last Sunday, April 6th, 2014, for members of my Weekly Strategy Session and 12631 (please click on those links for details about joining).
Have a great weekend!
-chessNwine
I. THESIS FOR THIS WEEK: THE CONTINUED SELLING BARRAGE IN THE LEADING PARTS OF THE MARKET POINTS TO AN ONGOING CORRECTION, DESPITE THE RESILIENCE OF THE LARGER CAP, LOWER GROWTH ISSUES. TRADERS SHOULD REMAIN IN A HIGHLY DEFENSIVE POSITION THIS WEEK, AS THE MARKET IS NOT YET OVERSOLD ACCORDING TO A VARIETY OF INDICATORS. THE MOST ACTIONABLE LONG IDEAS MAY BE SETTING UP IN THE SOFT COMMODITY COMPLEX, ONCE AGAIN.
A. RECAP OF THE ACTION
The benchmark S&P 500 index opened last Monday at 1859, subsequently making fresh all-time highs each day of the week starting on Tuesday. The latest high culminated on Friday morning, with a morning gap up to 1897. That move, however, was quickly faded as the broad market came under pressure for the rest of the session. By the time the closing bell rang on Friday, the S&P finished out the week at 1865.
For the week, the S&P rose 0.3%.
B. STRATEGY FOR PLAYING THE LATEST NEWS HEADLINES, EARNINGS SEASON, AND MACROECONOMIC DATA; SPECIFICALLY WEDNESDAY’S FOMC MINUTES, THURSDAY’S JOBLESS CLAIMS, AND FRIDAY’S PRODUCER PRICE INDEX.
[Please click here to see the full earnings slate of which firms report and when. Please also click here to see the full economic calendar for the week ahead (you might need to click ahead to Monday, April 7th.)]
Headed into a new earnings season, keep in mind there are plenty of different styles that can be profitable in the market as a trader. My discipline is to usually not hold trades through earnings reports. If you do want to hold a position through the firm’s earnings report, I would suggest that you consider lightening up the position a bit before the announcement in order to mitigate the known unknowns/risks you are assuming.
Either way, I urge you to check and then double-check your current portfolio holdings to see when the firms you own are scheduled to announce earnings. As a swing trader, I am almost always looking to significantly reduce or outright close a position into earnings. There are simply too many external variables, particular to the firm in question, from an earnings report for me to have an edge. As an example, even if you do possess some type of insider or unique information about a given firm’s impending earnings report, there is still no way to know how the market will react. Stocks can just as easily sell-off on great earnings as they can on horrific ones, and vice-versa.With that in mind, I want to point out one crucial difference between specific earnings reports relevant to the stocks of firms you own versus politics, a broad economic report, and monetary policy decisions. In trending markets, up or down, the macroeconomic data (not microeconomic, such as earnings reports) tend to be interpreted by the market in favor of the prevailing trend, even if the numbers wildly miss or easily crush expectations.
In sum, macro reports should not be treated as the sole reason to exit a stock, whereas a specific firm that you own reporting earnings most certainly can. Moreover, the reaction to the initial reaction in terms of the price action by the market after a given data point or earnings report is what matters most to swing traders.
Technical analysis has its clear limitations in that it can usually only analyze that which is currently known and legally knowable by the markets. To presume that charts can dictate everything into the future is pure folly. Trading, for all intents and purposes, is gambling, as we are wagering on outcomes yet to be determined. Instead of running away from that fact, a better approach is to embrace sound risk management principles and become astutespeculators.
II. THE WEEK AHEAD
A. CURRENT MARKET POSTURE
1. Changes In Market Latitude, Changes In Attitude
a) Leaders Lead…in Both Directions
Recent Strategy Sessions have focused on the ominous signs being flashed by the leading parts of the market, even as the S&P 500 Index and Dow Jones Industrial Average printed fresh all-time highs. Those warning signs began to manifest themselves in an even more pronounced manner last week, as the selling intensified in leading, high growth issues, such as biotechnology stocks, AMZN FB GOOG LNKD NFLX PCLN YELP, and small caps. This was all happening as the Dow and S&P hit new all-time highs on Friday morning, via an opening gap higher after the jobs reports.
As I noted last weekend, we have seen a shocking amount of opening gaps higher in the broad market over the past two weeks only to see the heart of regular cash session hours feature lethargic price action, at best, if not outright corrective or even bearish action in the leaders. Indeed, corrective or bearish markets tend to open strong and close weak, as large, institutional players unload their long inventory into unsuspecting retail players who buy into the opening strength.
Another hallmark of a new trend lower, or the early stages of a deep correction, is that leading stocks become oversold and then subsequently remain stubbornly oversold for quite some time. This is the flip side of the bullish roadmap we have previously used to determine a new bull market or fresh, healthy uptrend, where price becomes overbought in the leaders and seemingly defies gravity for quite some time before the inevitable, contained, and buyable pullback sets in.
Recall that leaders lead in both directions. Hence, the heavy selling of late in the liquid, marquee issues in the biotechs, small caps, and glamorous Nasdaq should continue to be taken very seriously as a potential sign of a major, new change in trend, or the early-stages of a much deeper bull market correction than we have seen in years.
b) Not as Bloody as You May Think, Just Yet
Another issue to consider is whether the market is, in fact, even currently oversold. The answer may surprise you, even for some of the more battered and bruised indices of late.
According to the NYSE McClellan Oscillator (“NYMO”), which is a simple market breadth indicator tool, we are not yet technically oversold anywhere close to the point where “buying the blood” is typically justified.
Generally speaking, when NYMO is above zero it tends to indicate bullishness for stocks, and below zero, bearishness. However, extreme readings can indicate overbought or oversold conditions. Above 50 is considered to be overbought, while below -50 is considered oversold.
Updating the NYMO daily chart, you can see we closed last week out at -10.35, bearish and not in oversold territory. In fact, NYMO actually closed a fraction higher than last week. Hence, the notion of buying the blood in the streets may be a bit premature here. Another sharp down day or two early this week, however, can easily see NYMO plunging into classic oversold territory.
c) The Split Market May Be Coming Together as a Whole
A major reason for the lack of oversold readings for the broad market, denoted by the NYMO analysis above, is, of course, the resilience of the S&P 500 and Dow Jones Industrial Average. Bulls have correctly been pointing out the recent rotations into these indices. However, the more pertinent issue for traders became how sustainable these capital rotations were.
On the weekly S&P 500 Index chart, note the long-running bearish RSI divergence to price at each all-time high since late-2013.
For reference, the RSI is simply the “Relative Strength Index” used to identify changes in technical momentum. Above 50 is generally considered a bullish RSI, with above 70 viewed as overbought. Trending below 50 is considered a bearish RSI pattern, with below 30 considered oversold.
Here, the RSI has been trending lower as price made fresh highs for months on end. This circumstance indicates that buyers are growing weaker with each subsequent thrust higher in price, in terms of their upside momentum.
Given that these negative divergences have been building for so long, we should combine that fact with the glaring weakness in the leading parts of the market. Fused together, this is even more reason to be skeptical of a sustainable rotation into the S&P.
Simply put, even the strongest indices of late have long-running bearish divergences of their own to reconcile.
And turning to the aforementioned Nasdaq and Russell for daily chart RSI analysis, you may also be surprised to see that neither index is oversold.
Both are sporting daily chart RSI readings (top pane on each chart) above 30, despite the obvious weakness in each index last week. Just as with NYMO, another sharp down or two lower can trigger oversold readings. But, even then, if this is a new downtrend, or a deeper correction is afoot, then you can expect to have far more trouble buying pullbacks than at any point since 2012.
In light of the above analysis, traders should continue to treat the current market as a corrective one, despite the Dow and S&P hitting fresh highs as recently as Friday. The heavy selling and downside price action in the leading parts of the market is too much of a warning to ignore, particularly for a market which has not seen a 10% correction since 2012. A heavy portfolio cash position for most traders is appropriate, as are shorts for aggressive traders. Longs should be kept on a tight leash for either intraday trades, or one/two day holds at most unless and until market conditions improve.
2. Trade Ideas of the Week, Old and New Editions, Part I.
First and foremost, there has also been resilience in other mega caps beyond those housed in the Dow Jones Industrial Average. The world’s largest, publicly-traded railroad, Union Pacific (not housed in the Dow Industrials. but is in the Dow Jones Transportation Average, of course), for example, has defied my prior thesis for its abnormally-steep multi-year angle of ascent to correct.
And yet, looking at the daily chart and combining it with the analysis in prior subsections, on top of the still too-steep multi-year angle of ascent higher, Union Pacific represents a strong holdout in this market ripe to succumb to the selling pressure in the leaders. A cover-stop above $191 for bearish bets is appropriate, targeting $182, then $175 on the downside.
On a relative basis, large cap biotech Amgen had held up better than its peers until Friday’s vicious selling hit. However, there is still room to drop to the 200-day moving average. And I still consider the stock a short idea headed into this week as long as price holds under $120.
Gilead is another major biotech which has been weaker than Amgen. The recent bounce-back created what can be seen as a bear flag, setting up another breakdown. I view this stock as a short setup under $72.
Speaking of biotechs, just as with my earlier analysis of the Nasdaq and Russell you will note the absence of an oversold RSI reading on the daily chart for the sector ETF. The RSI is still above 30, with room to drop before we would consider a contrarian buy signal, if at all.
3. Trade Ideas of the Week, Old and New Editions, Part II.
A Dow Component which is ripe to break lower is Boeing, and is a short idea headed into this week. I am looking for a move below $127 to get the ball rolling. A tight cover-stop above $130 is appropriate. Note that the stock has a clearly-declining 50-day moving average, rendering all rallies suspect.
The stock also printed an outside reversal day, or bearish “engulfing candle,” on Friday, after its recent bounce, suggesting the overall corrective nature of the chart is still in play and is ready to succumb to broad market pressures despite the resilient Dow.
The Goldman Sachs weekly chart bearish rising wedge was a thesis I advanced in these Strategy Sessions fating back to last year. Despite all of the whipsaws and proclamations by bulls for a sustained rotation into the big banks and financials, the weekly rising wedge, since 2011, on Goldman is still very much in play. As you can see, price breached the extended support trendline (lower light blue line), and recently retraced back up to it only to struggle.
Also note that Goldman is a Dow Component and is ripe for a short trade under $160, especially if the Dow finally succumbs to the selling in the Nasdaq and Russell. A close over $180 on a weekly basis likely renders this bearish rising wedge theory null and void.
For reference, the bearish rising wedge is a chart pattern that starts out with price in a wide range which soon contracts in terms of the swings as prices move higher. You are looking for at least two “reactions” or touches of the resistance trendline above, and usually three reactions of the support trendline below to help give the pattern the look of a wedge.
This theory behind the pattern is often difficult to grasp, in the sense that it is tough to call a pattern of higher highs and higher lows bearish. Moreover, the bearish rising wedge pattern is often a trap that eager bears fall into, as their yearning to call a major top sees them aggressively shorting an assumed breakdown (which often does not come to fruition) while price still works through an overall uptrend.
To defend against those kinds of blunders, consider that, as with all potential reversal patterns and candlesticks, overall chart context and maintaing trading discipline are key. The bearish rising wedge is most valid after a prior, established uptrend. The psychology of the pattern denotes that buyers are slowly losing their grip on the market as the price range narrows.
Of course, confirmation to the pattern in the form of a powerful breach and hold below the support trendline gives bears the best shot at actually capitalizing on the reversal, since otherwise the pattern can certainly either morph into another chart formation or prove to be a trap that eventually sees prices going much higher.
4. A Soft Consolidation for the Softs
Given our analysis of the soft commodity complex late-last year and earlier this year, I would be remiss not to follow-up on the space now that they have consolidated the initial rally. The explosive rally off multi-year lows has taken some time to digest. Of course, the issue for us was the nature of the correction–We did not want to see the lion’s share of recent gains erased.
Instead, the hallmark of sustained rally or even new bull market for the softs would be to see them consolidate in a fairly benign manner before resuming the next leg higher.
Observing the daily chart for the DBA, ETF for the ags/softs, you can see a narrowing consolidation without much price giveback, relative to the prior advance. This is exactly the type of action bulls want to see. A close over $29 now sets in motion the next leg higher, with $27 likely needing to hold below as support.
Corn, coffee, sugar, and soybeans represent the most appealing long ideas on strength, seen on their daily ETN and fund charts.
5. General Trading Concepts to Keep in Mind
It is important to remember that the stock market is the final arbiter. Regardless of our beliefs on political, fiscal, or monetary issues (oftentimes, all three can be combined), the opinion of the market is what matters most for technically-driven swing traders. There are many different ways to consistently profit in the market over time. The key, though, is not commingling styles for the sake of convenience or to try to substitute one style for another in lieu of discipline. A classic case would be making a bad trade, then deciding not to cut your losses and instead turning the bad trade into a long-term investment out of convenience.
Finally, it is crucial to be aware that at least eight out of ten stocks tend to move with the market, and most breakout plays fail in corrective markets. Thus, you simply must be aware of the overall market, regardless of how enticing any individual chart looks. If the market continues to improve, so too will breakout plays, almost by definition. If breakout plays break the hearts of eager hot money traders, that is a sign to exercise caution.
B. LEVELS TO WATCH
- On the S&P 500 Index: On the upside, note: 1867, then 1883. Downside levels of note: 1849/1850, 1823, then 1746.
- On the Nasdaq Composite Index: On the upside, note 4,131, 4,175, 4,219, then 4,246.Downside levels of note: 4,100, 4.064, then 3,968.
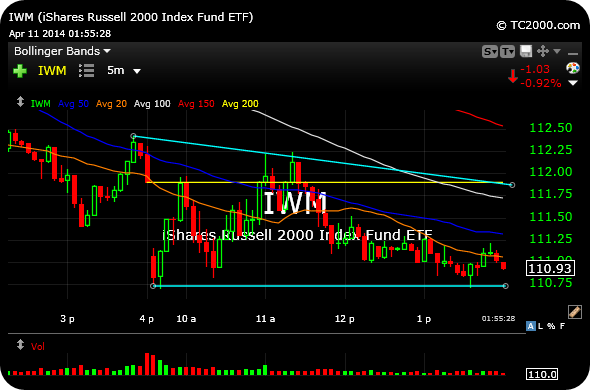
- On the Russell 2000 Index: On the upside, note: 1,165, 1,173, 1,177, 1,205, then 1,208. Downside levels of note: 1,148, 1,137, then 1,124.
III. LONG TRADING IDEASI like the following long ideas only on further strength this week. I recommend that you keep protective stop-losses on all trades, not much looser than 7-8% from where you initially buy. Also, please be sure to check earnings dates for any and all of your holdings.
- BMO
- CBPX
- CORN
- JO
- LO
- POM
- SGG
- SOYB
- TI
- UVXY
IV. SHORT TRADING IDEASHere are some ideas with vulnerable charts that I would consider swing trading on the SHORT side ONLY ON WEAKNESS in a broad market which accelerates to the downside. Short-selling includes unlimited risk, since stocks can rise indefinitely, or at least much longer and much higher than seems reasonable. Thus, I strongly encourage you to define your risk beforehand via a concrete buy-cover protective stop-loss, in the event the trade goes against you. Also, please be sure to check earnings dates for any and all of your holdings.
- AMGN
- AXP
- BA
- COH
- FDX
- GILD
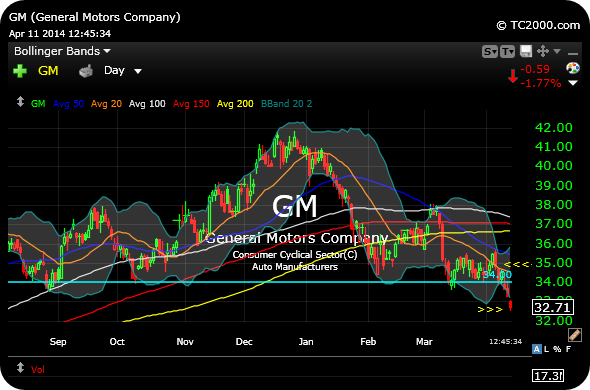
- GM
- GS
- INTC
- RL
- TIF
- TSN
- UAL
- UNP
- UPS
V. QUOTE OF THE WEEK“Victorious warriors win first and then go to war, while defeated warriors go to war first and then seek to win.” -Sun TzuTrade well. Protect your portfolio at all times.-chessNwine


Comments »