
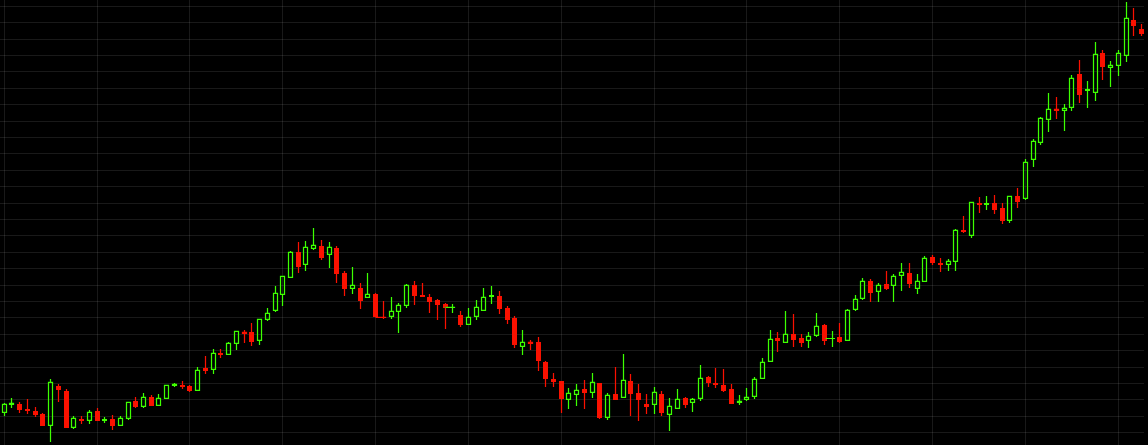
Hint this week: Monthly chart dating back to 2002.
Try to guess:
- The ticker symbol of the chart;
- The sector in which the stock trades; and
- Whether or not you think the stock will move higher or lower throughout 2014 or will break lower.
Thank you to everyone who has been playing along.
Please click on chart to enlarge
[Members: My latest Weekly Strategy Session has been published]
________________________________________________________________


I think it’s SHW The Sherwin-Williams Co. which is a “specialty chemical” company but we all know they sell paint. Looks like it’s due for a pullback to 175-185 in the near-term and that’s as far out as my crystal ball goes.
May I ask the time frame of the chart?
it’s a monthly chart, but I am going to have to retract my first “guess”. It’s not SHW but it’s probably 99% correlated with it. It’s not ORLY either but that looks very close too.
OK, it’s definitely HSY The Hershey Company – the sector is listed as Consumer Goods but we all know they make candy. A pullback to the low to mid 90’s is probably buyable as there is no reason to assume the uptrend is broken unless we see it is.
Pardon me for breaking my own rule earlier “one does not simply guess at name that chart”. It won’t happen again.
Nicely done once again.
Originally I figured it for an INDEX: I suspect that is a multi-year chart: I am guessing there may be a *trick to the question: so without researching I will guess it is a muli-year chart of $GOOG
lol i am being outclassed… $HSY looks right
No worries, actually in the past a few posters that “guessed” helped lead me to the correct answer. Chess, in his diabolical wisdom usually ties the chart to “a theme” of some sort. My “guess” is this time it’s Easter.
very cool ; )
Abbott? Looks like healthcare but which one???