
Well, it has been about six or seven months since we first looked at the novelty pattern on the U.S. Dollar/Japanese Yen currency cross. If you believe there are correlations between the Yen weakness and strength in equities since late-2012, then I think it is worth revisiting this pair.
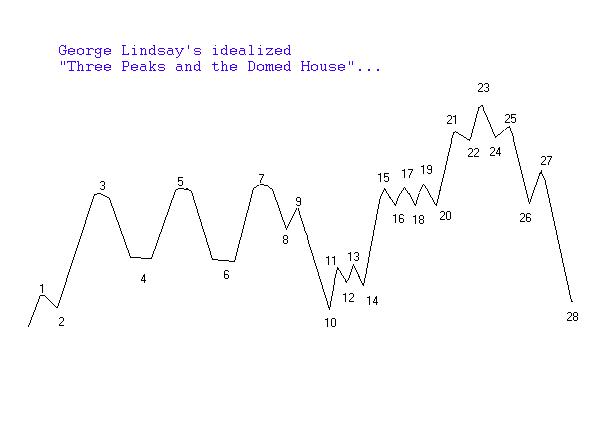
Over the past twenty-four hours, the action in the Yen has been fascinating. So, I wanted to update the pair below, as well as the original pattern which, again, I threw out there in this post more as a novelty than anything else. Nonetheless, some seven months later the pattern is still in play, unbelievably.
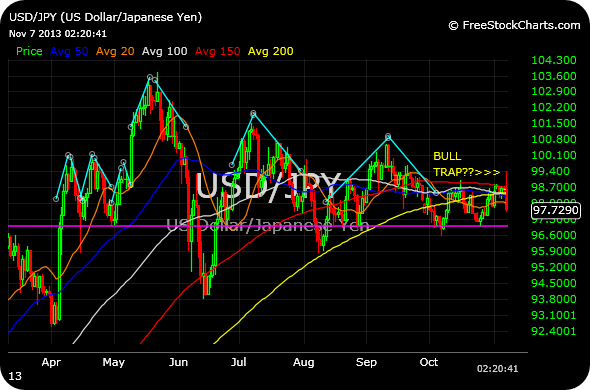
97, then 95, are the levels below I am watching. Recall that this chart shows the Dollar versus the Yen, meaning the lower it goes the stronger the Yen is and, by inference, pressure on equities increases.
Back in 2012, it hit and hit big for DECK on that stock’s downtrend.
_________________________________________________________________________
_________________________________________________________________________


http://www.youtube.com/watch?v=gndH9mhHPk0
Never drink Jobu’s rum.
Is VERY bad