I will be back in a bit with the daily timeframe of Potash and specific levels for trading ideas which is a chart request from @JCraddock1 on Twitter.
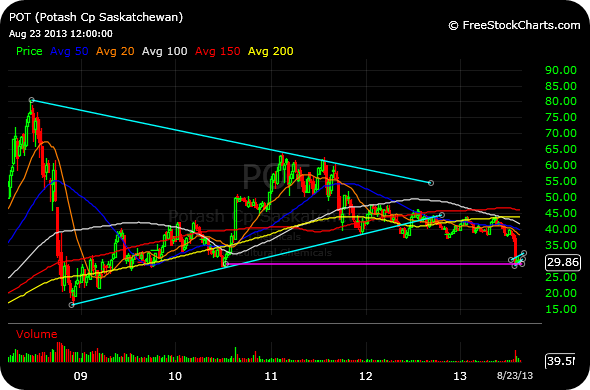
For now, consider the magnitude of the multi-year timeframe. Here we have a stock which broke down from a multi-year symmetrical triangle and is now bear flagging at its 2010 lows. You can see the potential for a drop down to the 2008 crash lows if this bear flag resolves lower.
Despite bounces in recent weeks, many major global material/industrial plays are still sporting similar setups. I doubt we see bonafide resolution in this last week of August.
But It should be a fun, high stakes September.
______________________________________


One comment
Pingback: More on POT | Technical Analysis with chessNwine