
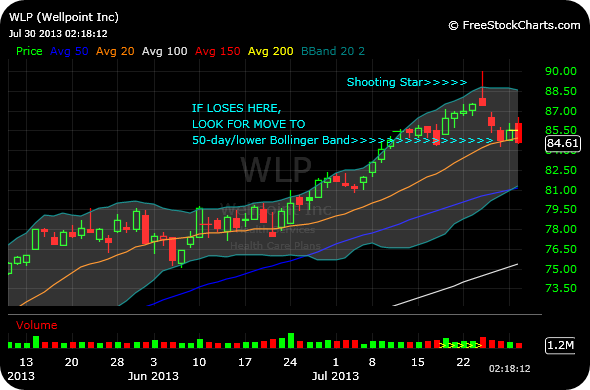
To update my post explaining the “shooting star,” in the Japanese candlestick theory of technical analysis. you can see that our real-time, actionable example of Wellpoint continues to confirm lower.
Currently, the stock is churning on its 20-day moving average, or middle Bollinger Band. If that is lost, I would be looking for a move down to the lower Bollinger Band, coinciding with the 50-day moving average.
Please click here to read my original post, fully explaining the candle and Wellpoint.
______________________________________________


Thanks for the update! And the focus on actionable ideas!
Thank you.