I. Background
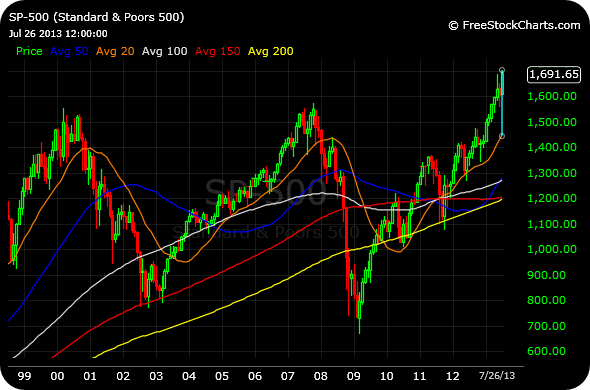
Over at least the past two decades, the 20-period monthly moving average on the S&P 500 has been an excellent very long-tem reference point for bull and bear cycles. When it is rising, you should generally be a long-term bull for the foreseeable future, while you should be in a multi-quarter bearish frame of mind when it is declining. When it smooths out, you should grow cautious and wait for resolution. A great example of this occurred in the spring 2008, where you can see below price touch the 20-period monthly from the underside, getting rejected, and falling into the depths of that vicious bear.
As with all moving averages, it is important to note the slope of the reference point and not just whether price is above or below at any given time. Too often, traders completely ignore the former aspect, while getting caught up in the latter to their detriment.
Another important point is to keep the timeframe in mind for perspective, as multi-day or even multi-week trades can be made counter to the trend below. The 20-period monthly moving average analysis is extremely beneficial to your market posture during largely volatile periods of confusion. As an example, in the summer of 2010 we had a nasty 16% broad market correction. At the time, I posted a monthly chart like the one below over on Stocktwits, noting that even though the market was quite scary and sentiment horribly negative, all that was happening was a pullback to the still-rising 20 period monthly moving average. Note below that we found support right near that rising 20-period monthly, on the updated S&P 500 Index monthly chart, below.
II. Applied to the Current Market
In the current market, there is no mystery as to whether we have been in a long-term bull cycle. The 20-period monthly moving average (orange line) on the S&P 500 Index is clearly rising and will continue to rise for at least several more months. Indeed, it would take quite a bit of selling into year end to smooth it out and turn it lower.
However, for our purposes I want to add a wrinkle to the above analysis.
This morning, we are going to focus on the distance between where price is now versus the 20-period monthly moving average. What you will note is that distance between price and that reference (the nearest-term major monthly moving average on my chart, mind you) is, on a percentage basis, similar if not steeper than what we saw at the 2000, 2007, and 2011 tops. So you can see the bear case for a reversion to mean.
Now, the bull case is that price may very well move sideways here as sector rotation fuels individual breakouts in stocks underneath the surface, all the while the rising 20-period monthly moving average comes up to meet price, rather than price coming down to revert to mean.
_______________________________________________


thanks chess. have you looked at chinas WMPs, shadow banking kinda reminds me of something that happened before. http://search.yahoo.com/r/_ylt=A0oG7j9.PvVRhxkAO0hXNyoA;_ylu=X3oDMTEzYzhibHQ3BHNlYwNzcgRwb3MDNARjb2xvA2FjMgR2dGlkA1NNRTIxMV8x/SIG=132bfogn6/EXP=1375055614/**http%3a//seekingalpha.com/article/1515482-week-in-fx-asia-china-s-wmp-count-down
Interesting stuff, thanks.
great perspective in this analysis. Enlightening to say the least. Thanks.
Thank you, sir.
really great, Chess..
Thanks, Sooz!
Interesting. But problem is this also occurred in 1995-96 and market continued to soar. Thanks.
Good point, goes to the issue of whether or not you think it is a secular bear where we blow-off the next few years like we did then.
Could you go into detail about this statement: “it is important to note the slope of the reference point and not just whether price is above or below at any given time”?
This sounds like you have some very interesting thoughts that would shed light but you don’t actually discuss it. Could you explain what you mean?
Sure, it is a concept I discuss frequently in my blog and daily video recaps…Whether the moving average is rising or declining tells you more, oftentimes, than whether price marginally undercuts it or overshoots it. It is a “moving average” over a given period of time, after all, and thus gives the essence of the market’s character with its slope.