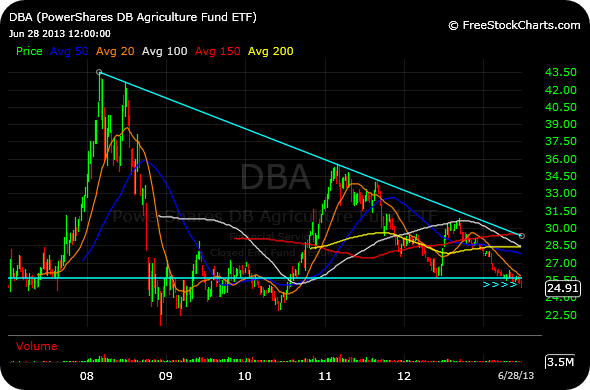
The original read on DBA, ETF for the soft commodities, probably should have been good enough, as I wrote in “DBA: Doing Business as a Laggard,” in this post in May. As it turned, out the subsequent potential breakout in corn proved to be nothing but a trap.
To update those charts, DBA just lost 2012 support, and unless this is some mega bear trap, things have gone from bad to worse as you can see the multi-year descending triangle starting to give way.
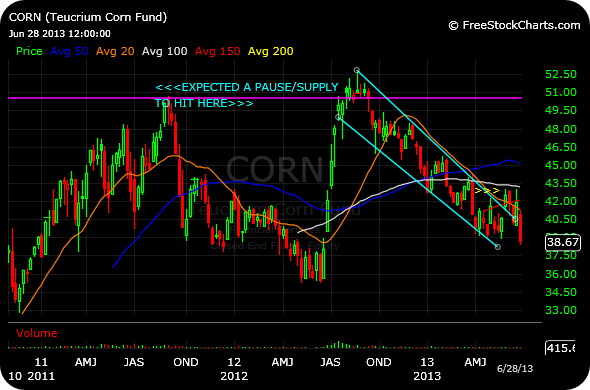
Similar comments apply to the once-promising CORN chart, second below.
___________________________________
___________________________________


I’m pissed that I haven’t got a
break at the pump. This is why $sbux is at a 52 week high.
http://www.finviz.com/quote.ashx?t=JO&ty=c&ta=1&p=d
Good point
Two Year Chart $JO vs $SBUX
http://finance.yahoo.com/echarts?s=JO+Interactive#symbol=jo;range=2y;compare=sbux;indicator=volume;charttype=area;crosshair=on;ohlcvalues=0;logscale=off;source=undefined;
how do you like short $CF on corn weakness? braking down out of bear flag on weekly.
yup, looks weak
Corn Leads Grain Plunge as U.S. Acreage Tops Estimates http://bloom.bg/14AMraF via @BloombergNews
yup, thanks