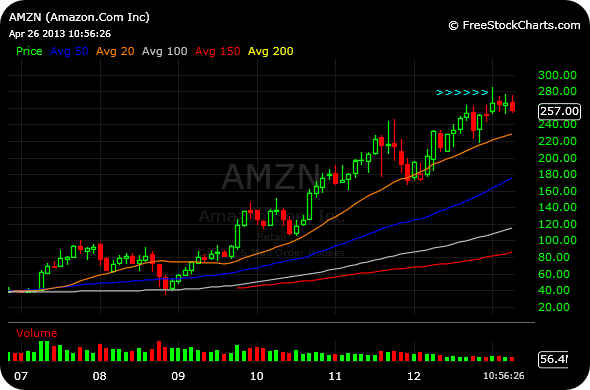
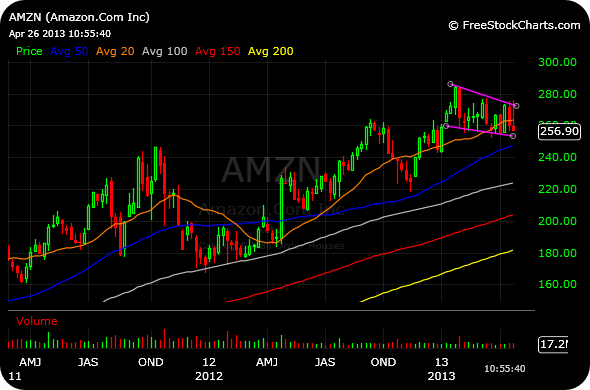
The second chart below is the monthly timeframe of Amazon.com, which is currently selling off after earnings. Recall this blog post in early-February where the monthly candle from January put us on watch for a downside reversal, being a bearish “shooting star” variant. We have not exactly seen downside forceful confirmation of a long-term bearish reversal here. But Amazon is certainly churning far much than bulls would like to see, as the weekly chart, first below, illustrates. It is also worth noting that the shooting star has yet to be negated.
I am looking at $280 as the level to watch above, while bears are close to pushing down through $252 for another leg lower.
While the bull case for a Nasdaq-led market rally higher may not fully rest on Amazon’s shoulders. It is certainly worth watching how this chart develops into the late-spring months.
__________________________________
__________________________________