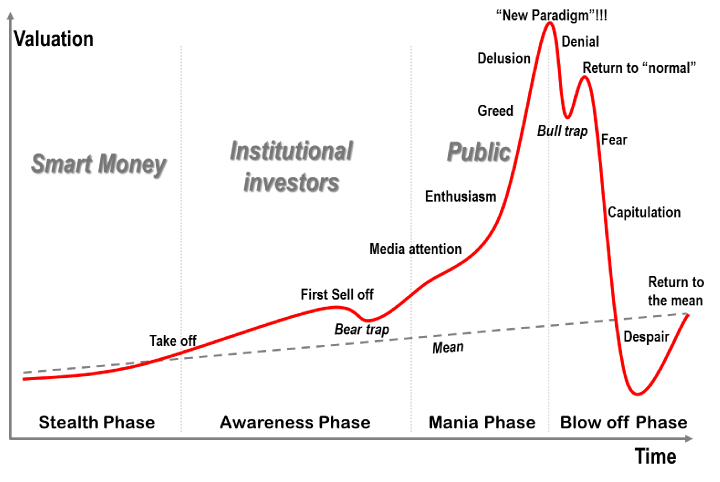
Great chart here courtesy of Jean-Paul Rodrigue, Dept. of Global Studies & Geography, Hofstra University and via Barry Ritholtz at The Big Picture blog, showing the cycle of human emotions which takes place during bull and bear runs.
One of the more fascinating debates since March 2009 has been the prevalent sentiment at any given time. Of course, timeframe makes this all the more subjective, because the chart below can be applied to days, or weeks, or months, etc…
Where do you think we are in the cycle, assuming it started in March 2009?
Feel free to chime in below with your reasoning.


Stealth phase was 09-11, First Sell-Off was Summer of 11….we’re right at Media attention, probably push into enthusiasm end of ’13-early ’14
Thanks!
Bitcoin following this chart nearly lockstep and seems to be between enthusiasm and greed
good points
Dow 14000 made big headlines.
I put us between enthusiasm and greed, closer to enthusiasm. The story of “Mom and Pop” investors re-entering the market this late in the game, as referred to in this article by Brett Arends, was widely circulated. http://www.marketwatch.com/story/mom-and-pop-the-worlds-worst-investors-2013-04-04
Of course we could be a couple of years away from a significant top, but these people probably swore they would never touch stocks again. What are they thinking?
Thanks, Bozo!
Canadian new magazine cover from February http://goo.gl/uVV3X
I think when Canadian go “risk on” its more significant LOL.
I haven’t heard anyone use the term “New Paradigm yet” but the people who keep chanting “you can’t fight QE” are coming close
I don’t think we have PE’s and other metrics that put us at delusional though.
LoL nice Bernie