Here is an interesting chart from David Wilson of Bloomberg, via Barry Ritholz’s The Big Picture blog.
We are looking at the fifth year of a broad market rally, assuming you are looking at March 2009 your starting point. Also note that I made a video several weeks back offering an alternative thesis that October 2011, off that 20%+ correction, may have marked the beginning of a new cyclical bull after a mini-bear cycle from May 2nd, 2011-October 4th, 2011.
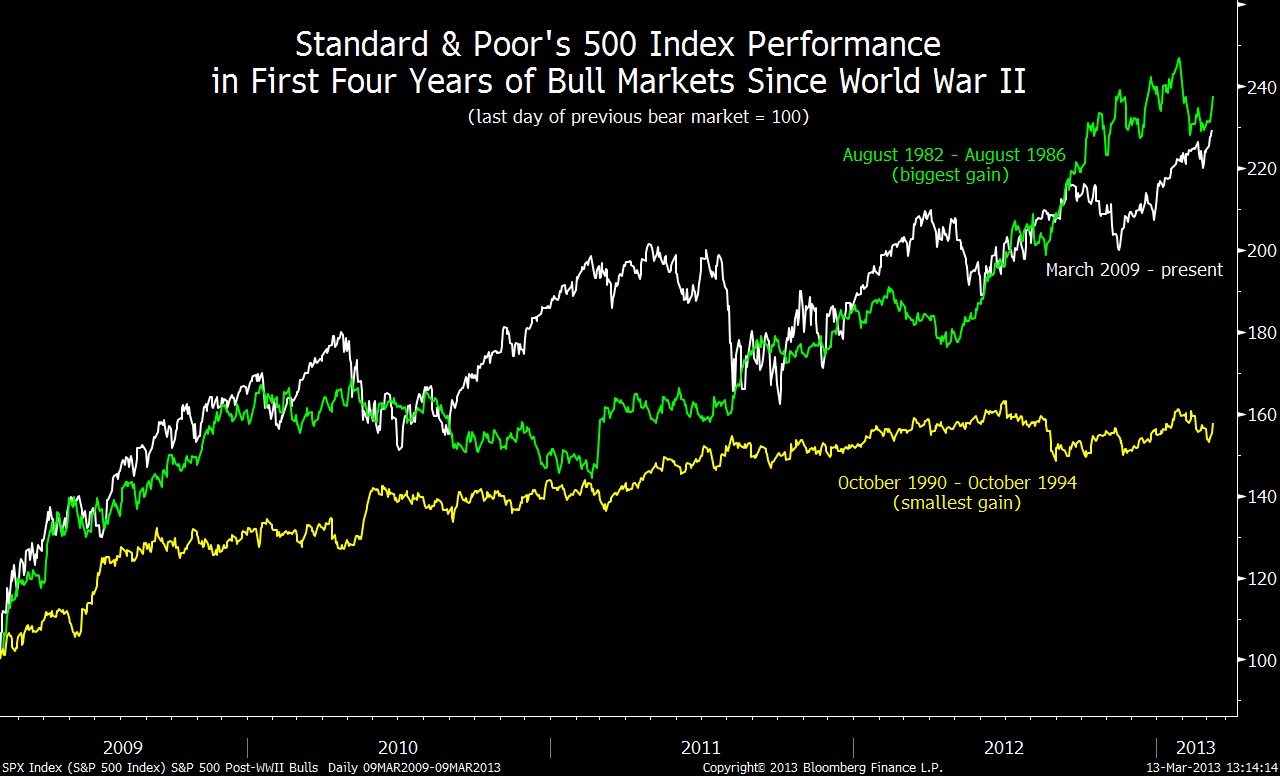
At any rate, here is the chart, with expected returns versus other historical instances. Note that the other rallies came within secular bulls, while I would argue based on the Nasdaq we remains in a secular bear since 2000.
(Click to enlarge)